U.S. data centers and your electricity bill: mapping the state-by-state impact
What’s behind the dizzying rise in your electric bills? Among everything else – inflation, climate, or utility politics – it’s the data centers powering the streaming, cloud services, and the endless digital world Americans use every day.
This InvestorsObserver’s research digs into historical energy pricing across all 50 states and reveals that electricity prices have climbed a lot since 1990, especially in regions hosting large clusters of data centers.
Using a unique dataset tracking state-by-state costs from 1990 through August 2025, including robust technical details about data center growth, this analysis connects everyday bill shock to the hidden physical infrastructure of America’s digital age.
Whether you’re in California, Virginia, or Texas – or smaller states like Maine – this is your guide to understanding what’s really happening when you flip the switch.
Key findings
- Average electricity price nationwide jumped 83% since 1990: $7.54 to $13.82 per kWh in 2024, and $14.87 by August 2025.
- National increase from 2020 to August 2025: 34% – the fastest five-year surge in recent history.
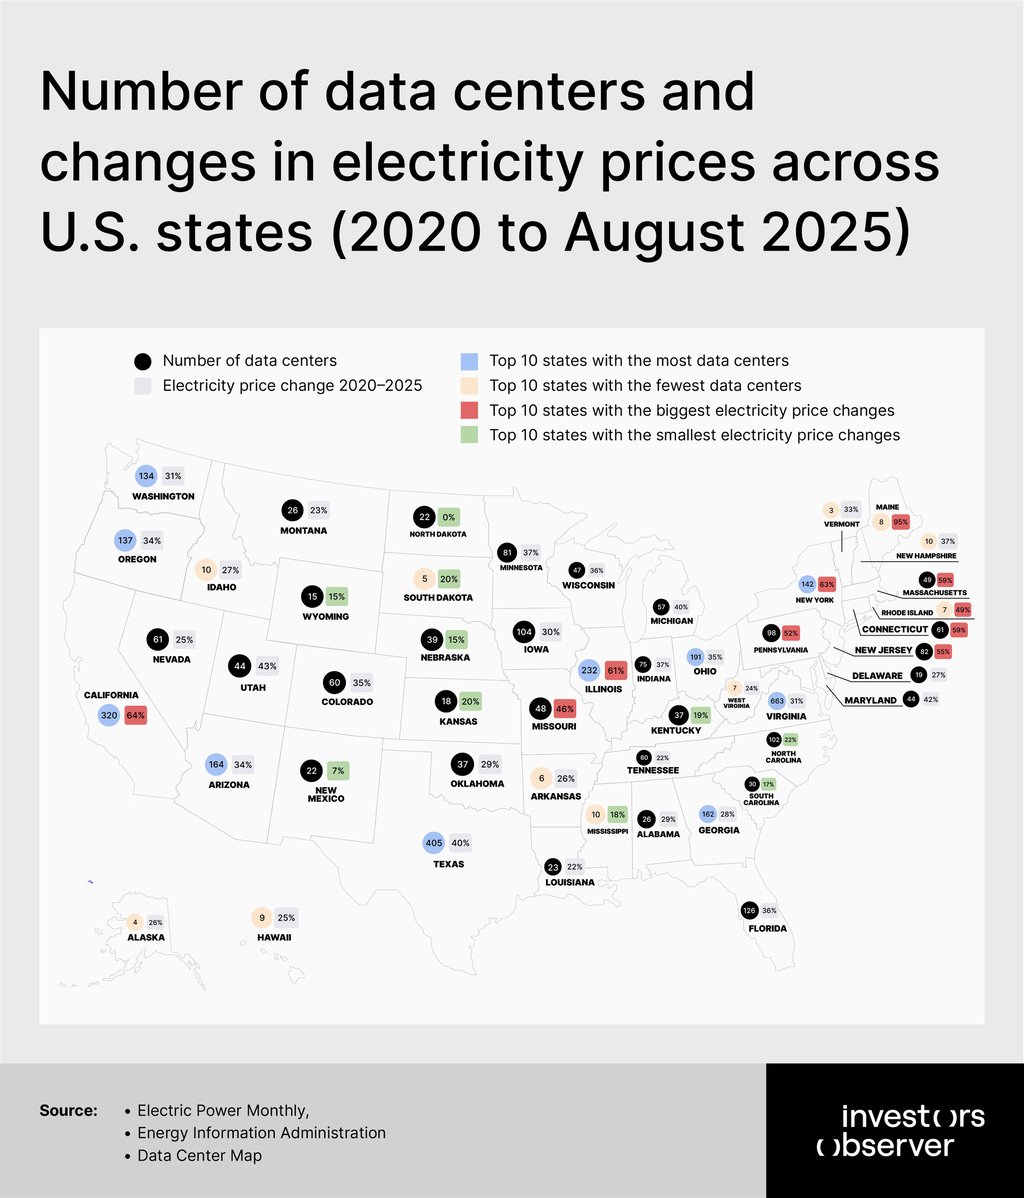
- States with the biggest number of data centers (Virginia, Texas, California) saw both high infrastructure growth and steep price increases, but the correlation isn’t simple – Virginia’s prices rose only 31% from 2020 to 2025, while California jumped 64%.
- Maine takes the dubious crown for fastest price rise (2020–2025): up 94.6%.
- The top quartile of high–data center states averaged 39% price hikes in five years, versus 32% for low–data center states – counterintuitively, average prices in high – data center states are still lower than in the least digital states.
- The year with the steepest inflation: 2022–2023, average spike 6%.
- Data centers don’t always mean higher prices: North Carolina, Georgia, and Iowa have large numbers of centers but moderate price increases.
The 1990s: stable prices in the pre-digital era
The 1990s was electricity's last calm decade. With a national average of $7.70 per kilowatt-hour, Americans enjoyed relatively predictable and affordable power. Prices ranged from just $5.22 in Kentucky to $15.11 in Hawaii – a spread that reflected geography, fuel sources, and island isolation more than digital demand.
The decade had minimal price pressure: the average change from 1990 to 1999 was actually slightly negative at -1.8%, with many states experiencing modest declines as deregulation experiments took hold and natural gas became cheaper.
Connecticut stood out with the decade's steepest increase at 11%, rising from $9.87 to $10.99, while industrial Midwest states like Illinois, Ohio, and Pennsylvania saw prices drop 6-9% as energy markets opened up.
California, already expensive at $9.88 in 1990, crept upward just 3.7% to $10.25 by decade's end. Data centers were essentially non-existent outside a few tech hubs. Most Americans had never heard the term "server farm." The internet was dial-up, streaming didn't exist, and cloud computing was science fiction.
Interestingly, the decade showed two distinct phases: prices rose modestly through the mid-1990s (up 3.6% by 1995), then actually declined 5% from 1995 to 1999 as competitive markets and fuel abundance took hold. States like Washington and Idaho, blessed with hydroelectric power, enjoyed rates below $5.50 throughout the decade.
New York, despite its size, saw prices fall from $12.11 to $11.88. The 1990s set a baseline that, in hindsight, looks impossibly cheap: Texans paid $7.22, Virginians $5.88, and even New Yorkers stayed below $13.
The digital revolution was just beginning, and electricity remained a boring, stable utility expense that families rarely worried about. Within a decade, everything would change.
The 2000s: the first shock wave
The 2000s marked electricity's first major upheaval in modern American history. The national average surged to $8.65, and more importantly, the average state saw a stunning 40% price increase from 2000 to 2009 – the steepest single-decade jump in the dataset. This was a systemic shock caused by fuel costs, grid investments, early renewable mandates, and the first wave of serious data center construction.
Hawaii led the carnage with an 85% increase, rocketing from $14.50 to $26.88 as oil dependency and isolation compounded. But the real story was in previously stable markets: Maryland jumped 80%, Delaware 58%, Kentucky 57%.
Texas, home to growing tech corridors in Dallas and Austin, saw prices leap 47% from $6.71 to $9.88. Virginia, quietly becoming the data center capital of America, climbed 44%. Even California, already expensive, rose 30% to $13.25.
The decade split into two acts. From 2000 to 2005, prices rose a manageable 17.9% as natural gas prices climbed and utilities upgraded aging infrastructure. But the second half hit harder: 2005 to 2009 brought another 19.8% increase, punctuated by the 2007-2008 energy and financial crisis. In 2007, the national average was $9.65. By 2008 it hit $10.11 (up 4.8%), then $10.18 in 2009. The financial crisis slowed the bleeding but didn't reverse it.
Data centers began their explosive growth in this decade, particularly in Northern Virginia (serving Washington DC and the federal government) and Silicon Valley. Amazon Web Services launched in 2006. Google and Microsoft expanded server farms aggressively.
Energy demand from these facilities was still modest compared to what was coming, but the groundwork was laid. States that attracted data centers – Virginia, Texas, Georgia – had substantial price increases, but so did everyone else. The 2000s proved that America's electricity infrastructure was more fragile and expensive than anyone realized, and the digital age had barely begun.
The 2010s: the deregulation paradox
After the 2000s' brutal 40% increase, prices rose a comparatively modest 9.7% from 2010 to 2019, with the national average reaching $10.66 for the decade. But this apparent calm masked enormous regional divergence and a fundamental shift: data centers exploded in number (Virginia alone went from dozens to hundreds of facilities), yet some major tech states actually saw prices fall.
California was the outlier, with prices soaring 25% from $13.56 to $17.01 as renewable energy mandates, grid modernization costs, and regional bottlenecks collided. By contrast, Texas – adding data centers furiously in Dallas, Austin, and San Antonio – saw prices drop 9.5% from $8.55 to $7.74, a huge reversal driven by deregulated markets and abundant wind power.
New York’s prices fell 9.6% despite the state’s growing role in finance-sector data infrastructure. Pennsylvania, Maryland, and Delaware all saw declines as well.
The decade’s mid-point, 2015, marked a high-water mark at $10.84 before prices drifted back down, then stabilized. From 2016 to 2019, national averages hovered around $10.50-$11.08, the most stable four-year stretch in decades.
Virginia, now home to over 600 data centers (more than any state), saw just a 9.3% increase, rising from $8.13 to $8.89. Ohio, Arizona, and Illinois all posted single-digit increases.
What explains this paradox? Cheap natural gas from fracking, renewable energy hitting cost parity, and efficiency gains all played roles. Data centers themselves became more energy-efficient per computational unit, even as their total numbers soared. Deregulated markets in Texas and the Northeast allowed competition to suppress prices.
But the calm wouldn't last. By 2019, storm clouds were gathering: aging infrastructure, climate events, and a looming pandemic would trigger the 2020s’ unprecedented surge. The 2010s proved that data center growth and price increases weren’t perfectly correlated – policy, fuel costs, and market structure mattered just as much.
The 2020s: the great acceleration
The 2020s have been catastrophic for American electricity bills. Through just the first five years (2020-2024), the national average jumped 24.4%, and by August 2025 the cumulative increase since 2020 reached 34%. Prices went from $10.96 in 2020 to $13.82 in 2024 to $14.87 by mid-2025.
2021 brought a 7.1% increase, 2022 a shocking 12% (the inflation surge), 2023 another 6.3%, a brief relief in 2024 (-1.1%), then a 7.6% jump to August 2025. Americans now pay more than they ever did, and the pain is accelerating, not slowing.
Maine epitomizes the crisis: from $11.88 in 2020 to $23.12 by August 2025 – a 95% increase in five years despite having just 8 data centers. New Hampshire and Massachusetts, also in the Northeast, saw increases near 50%.
California, already expensive, surged from $17.89 to $29.31 (+64%), now averaging $22.63 for the decade. New York jumped 63%, Illinois 61%. Even traditionally cheap states felt the pain: Texas rose 35%, Virginia 31%.
The pandemic years (2020-2021) averaged $11.34 nationally. Post-pandemic (2022-2024) averaged $13.64 – a 20% jump in just two years. The 2022-2023 spike hit hardest in New England: New Hampshire (+19%), Maine (+18%), Rhode Island (+18%), Massachusetts (+17%), Connecticut (+13%). These states saw energy costs spiral from supply chain disruptions, fuel shortages, and grid strain.
Data center states showed mixed results. Virginia, with 663 facilities, managed just 20% growth from 2020 to 2024 – among the lowest. North Carolina (102 centers) rose 19%. But California (320 centers) and Illinois (232 centers) both exceeded 45%. The correlation is weak. Regional energy policy and fuel markets matter more.
The Northeast's suffering stems from constrained natural gas pipelines, renewable transition costs, and aging infrastructure – not server farms. The South's relative affordability reflects abundant gas, newer infrastructure, and pro-business climates. The 2020s have proven that digital infrastructure is one factor among many driving America's electricity crisis, but the crisis itself is undeniable and worsening.
Data centers: impact and paradox
Data center growth is real. Virginia leads with 663, Texas has 405, and California 320. But while data concentration brings higher local energy demand (and sometimes higher bills), the relationship isn’t simple.
Virginia’s prices are much lower than California’s and even lower than some low-data center states (like Maine, Rhode Island, or New Hampshire). In fact, some states with relatively modest data center footprints – Connecticut, Massachusetts, New Jersey, Pennsylvania, Missouri – had some of the fastest power price hikes. The costliest, Maine, only houses 8 centers.
What can explain the difference?
- California’s bills reflect not just tech demand, but renewables policy, grid bottlenecks, and higher regulatory costs.
- Virginia’s energy is kept cheaper by abundant supply and massive utility-scale investment, even as demand soars.
- Maine’s price spiral owes more to regional supply shortages and fuel costs than to the handful of server farms.
States in the bottom quartile for data centers (like Alaska, Vermont, Delaware) are paradoxically among those with higher average prices ($11.21/kWh vs. $9.31), with smaller five-year increases (32%) but a persistent baseline of expensive power.
Year-over-year shock: 2020–2025
2020: the average bill was already high at $10.96.
2021: Up 7.1%.
2022: A spike – up 12%.
2023: Continued climb (6.3%).
2024: A rare pause (-1.1%).
2025 (August): Another surge (+7.7%).
States with the worst acceleration in 2024–2025: Maine (30%), New Jersey (27%), Missouri (22%), New York (21%), Illinois (21%). This was part of a longer trend following policy shifts, fuel supply, and exploding tech demand.
Are data centers really to blame?
From 2020 to 2025, the top 5 data center states (Virginia, Texas, California, Illinois, Ohio) all saw increases well above the national baseline (Virginia +31%, Texas +40%, California +64%, Illinois +61%, Ohio +36%).
Yet, the presence of hundreds of data centers doesn’t guarantee top-tier costs for residents, and price inflation is clearly contagious, as it affects every region and every consumer.
Consumers in Maine and the rest of New England are hit hardest: prices in these states are highest and have risen most aggressively since 2020 (up to 95%). Here, residents pay nearly double the national average, yet digital tech is only part of the story.
Volatility is the new normal for American electric bills
Electricity bills across the U.S. have become unpredictable, sharply swinging from year to year. Since 2020, prices have risen an average of 6.1% annually, but the real story is in the wild fluctuations: a 7.1% jump in 2021, a 12% surge in 2022, a modest drop in 2024, and then an 11.4% increase through August 2025.
For the average household using 900 kilowatt-hours a month, this means bills climbed from about $99 in 2020 to nearly $134 by mid-2025 – an extra $423 annually, or a 36% increase over five years.
The strain is even heavier in some states. Californians saw monthly bills soar from $161 to $264, while households in Maine now pay more than $1,200 extra each year, nearly doubling their electricity costs.
This disparity reflects local energy policies, infrastructure investments, and regulatory approaches. Twenty-seven states have faced price hikes exceeding 30%, eight states have seen increases above 50%, and Maine tops the list with a 95% rise in electricity costs.
A major driver of rising energy demand is the digital economy. Data centers powering AI, cloud computing, and streaming services consume massive amounts of electricity.
Virginia alone hosts 663 of the nation’s 4,100 data centers. While these centers are getting more energy-efficient per task, overall consumption climbs as digital services explode in popularity.
States hosting data centers face a tough balancing question. These facilities generate jobs and tax revenue but also strain local power grids and contribute to higher residential rates. Who should pay for the costly infrastructure upgrades is a growing political debate, with answers differing widely across states.
The Northeast faces some of the highest costs, paying nearly double per kilowatt-hour compared to Southern states. Aging infrastructure, limited fuel options, and regulatory challenges have driven prices upward, turning energy affordability into a pressing crisis rather than a technical issue.
Investments in grid modernization, renewable energy, and diversified power sources have helped states like Virginia and North Carolina keep price growth manageable. But for others, especially in New England, rising prices threaten economic vitality, pushing businesses and residents to relocate to cheaper regions.
Electricity costs now shape the geography of opportunity and prosperity in America. What was once a simple utility bill has become a critical factor in regional economic competitiveness and quality of life.
Methodology and sources
In this research, we collected electricity prices for each U.S. state from 1990 through August 2025. Each year shows the average electricity price for each state (in cents per kilowatt-hour).
The electricity price represents the total average, meaning it includes all sectors – residential, commercial, industrial, and transportation.
The primary data source is the U.S. Energy Information Administration (EIA). The data is aggregated from approximately 3,200 investor-owned utilities, publicly owned municipal utilities, and electric cooperatives across the U.S.
For 2025, we used the most recent available data from the Electric Power Monthly (EIA), which includes information up to August 2025.
We calculated the 36-year average electricity price for each state, including 2025 data. Additionally, we calculated the national average electricity price for each year, aggregating data from all 50 U.S. states.
Numbers of data centers located in each state were sourced from the Data Center Map.