
In city after city, the American dream of homeownership is slipping further from reach. In 2025, new research from the InvestorsObserver’s team reveals a sad reality: in some of the nation’s largest urban centers, married couples and single residents are locked out of the vast majority of neighborhoods.
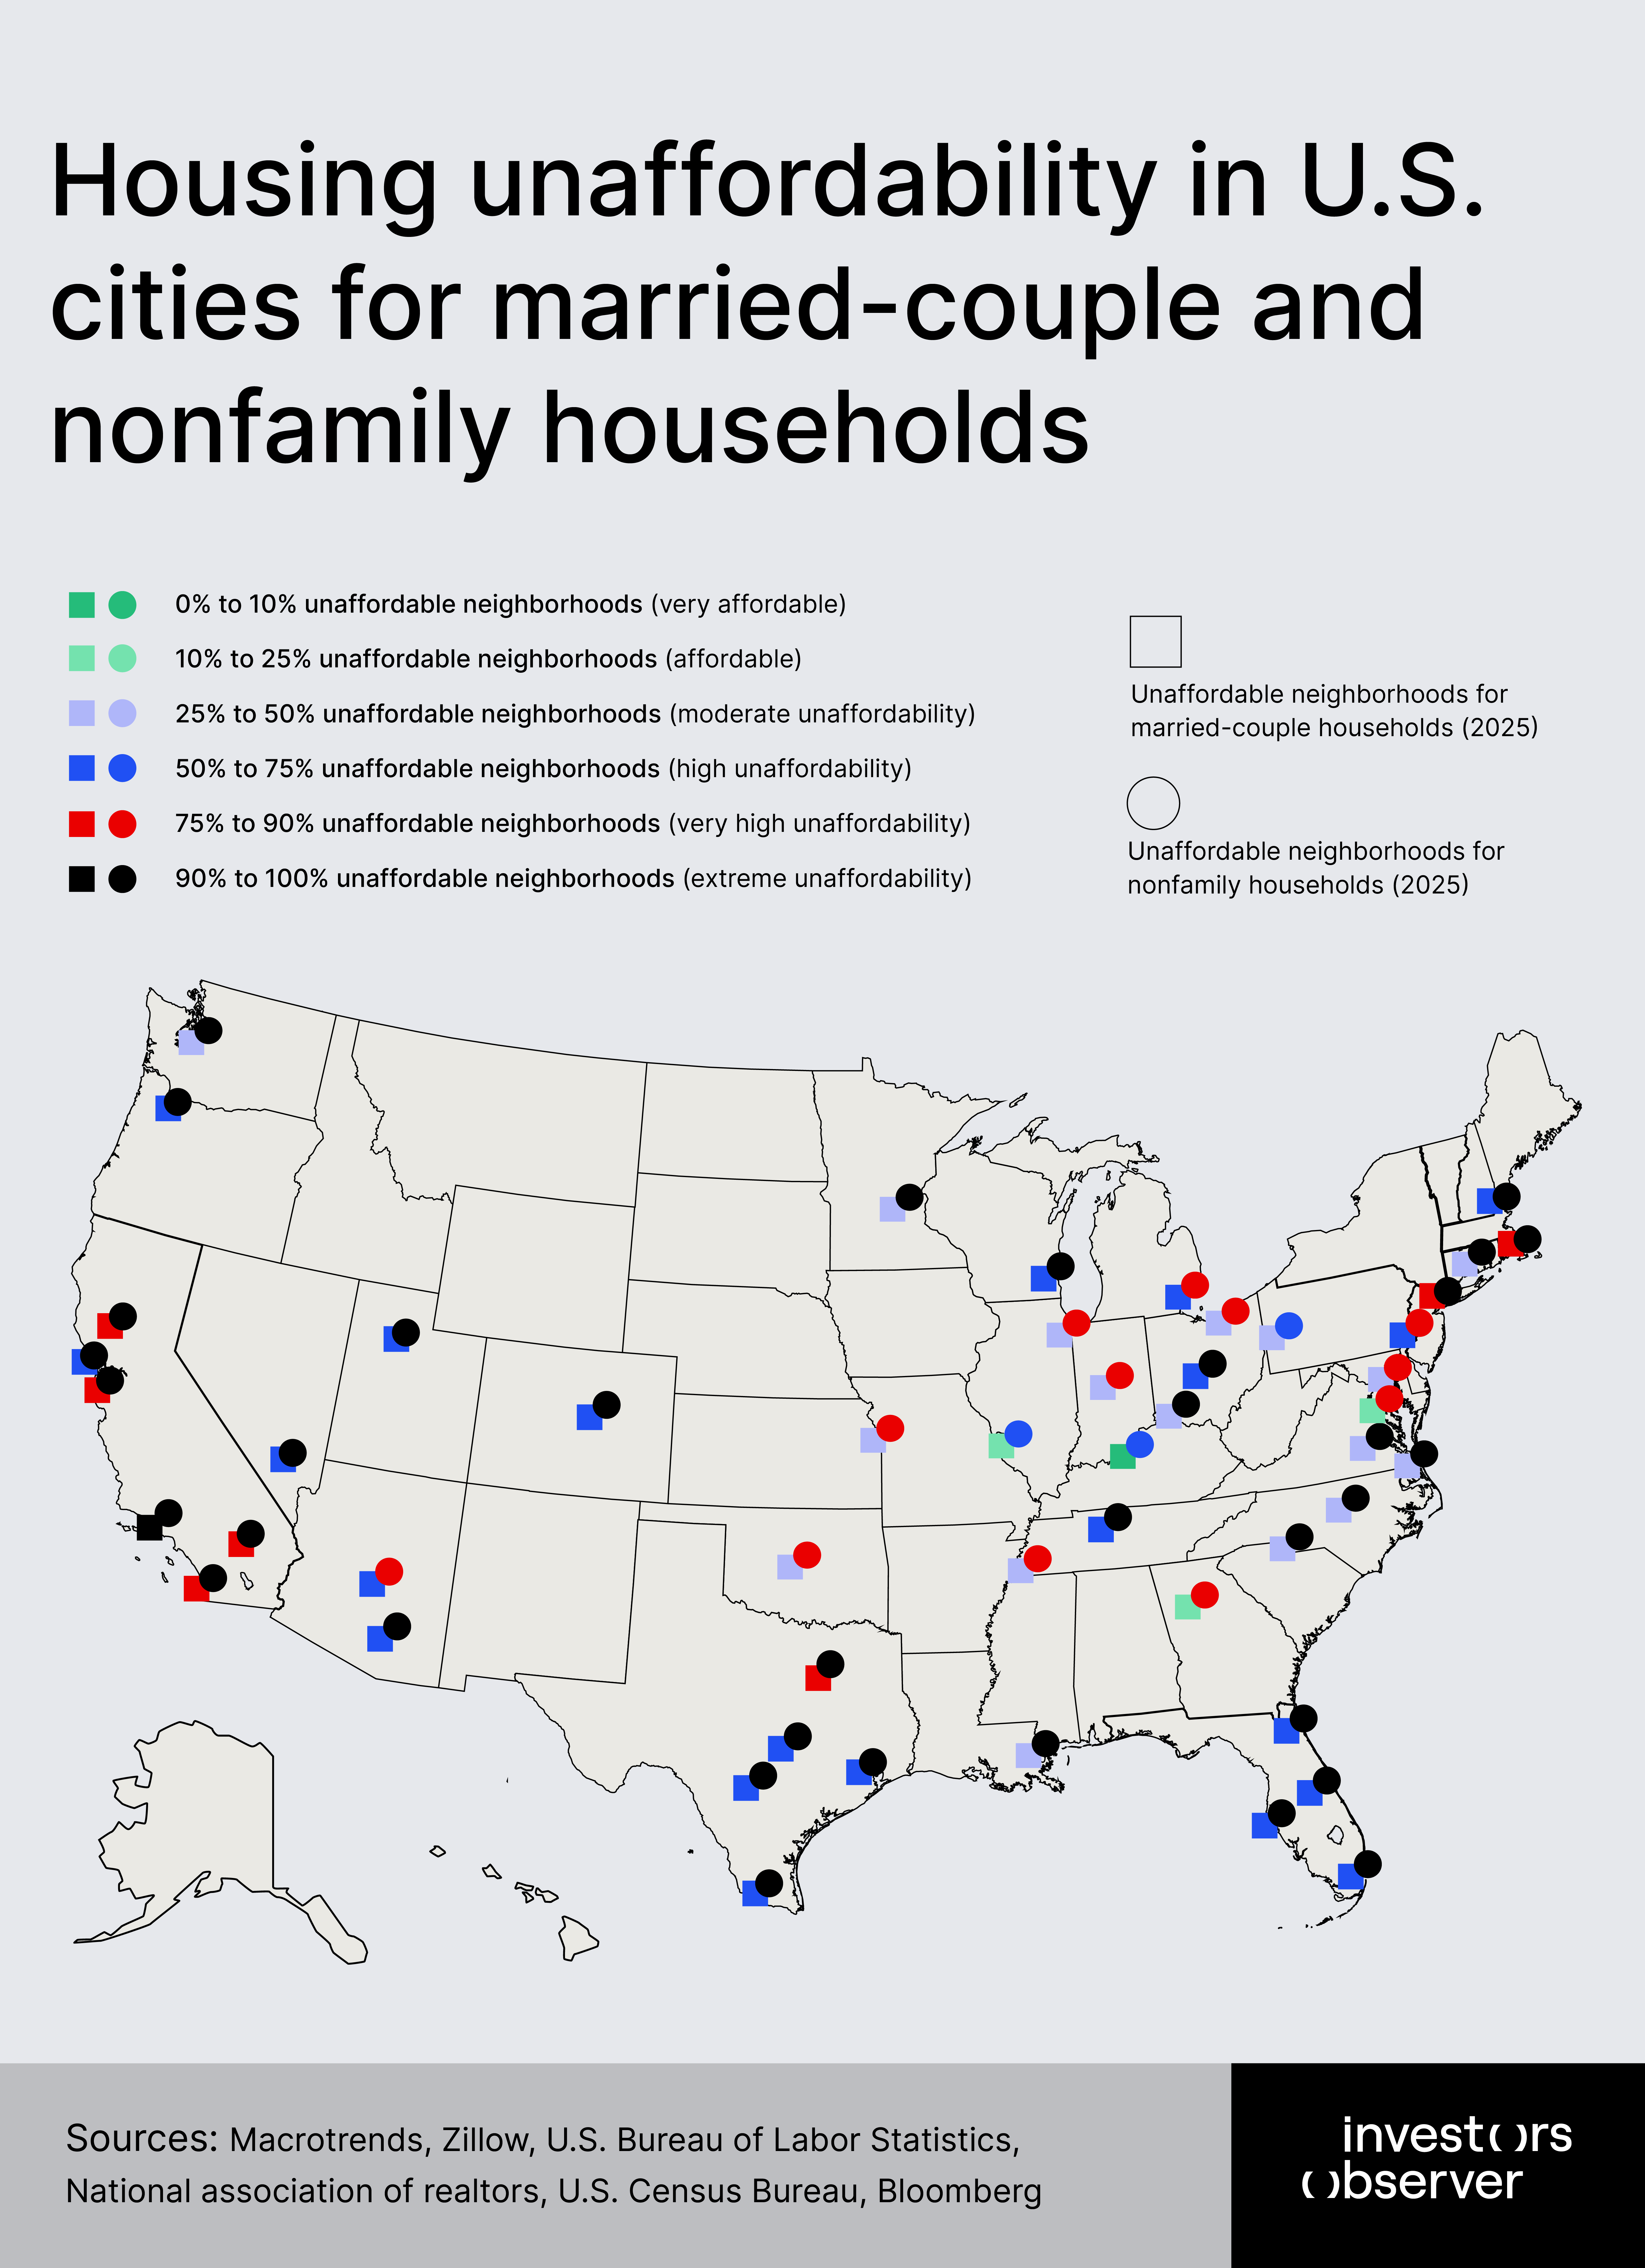
An analysis of the 50 largest U.S. cities shows disparities in housing affordability, identifying places where high incomes are no longer enough to secure a home, and a handful of cities where the door remains, if only barely, open.
The findings illuminate the shifting contours of inequality, mobility, and opportunity in 21st-century America.
Key findings
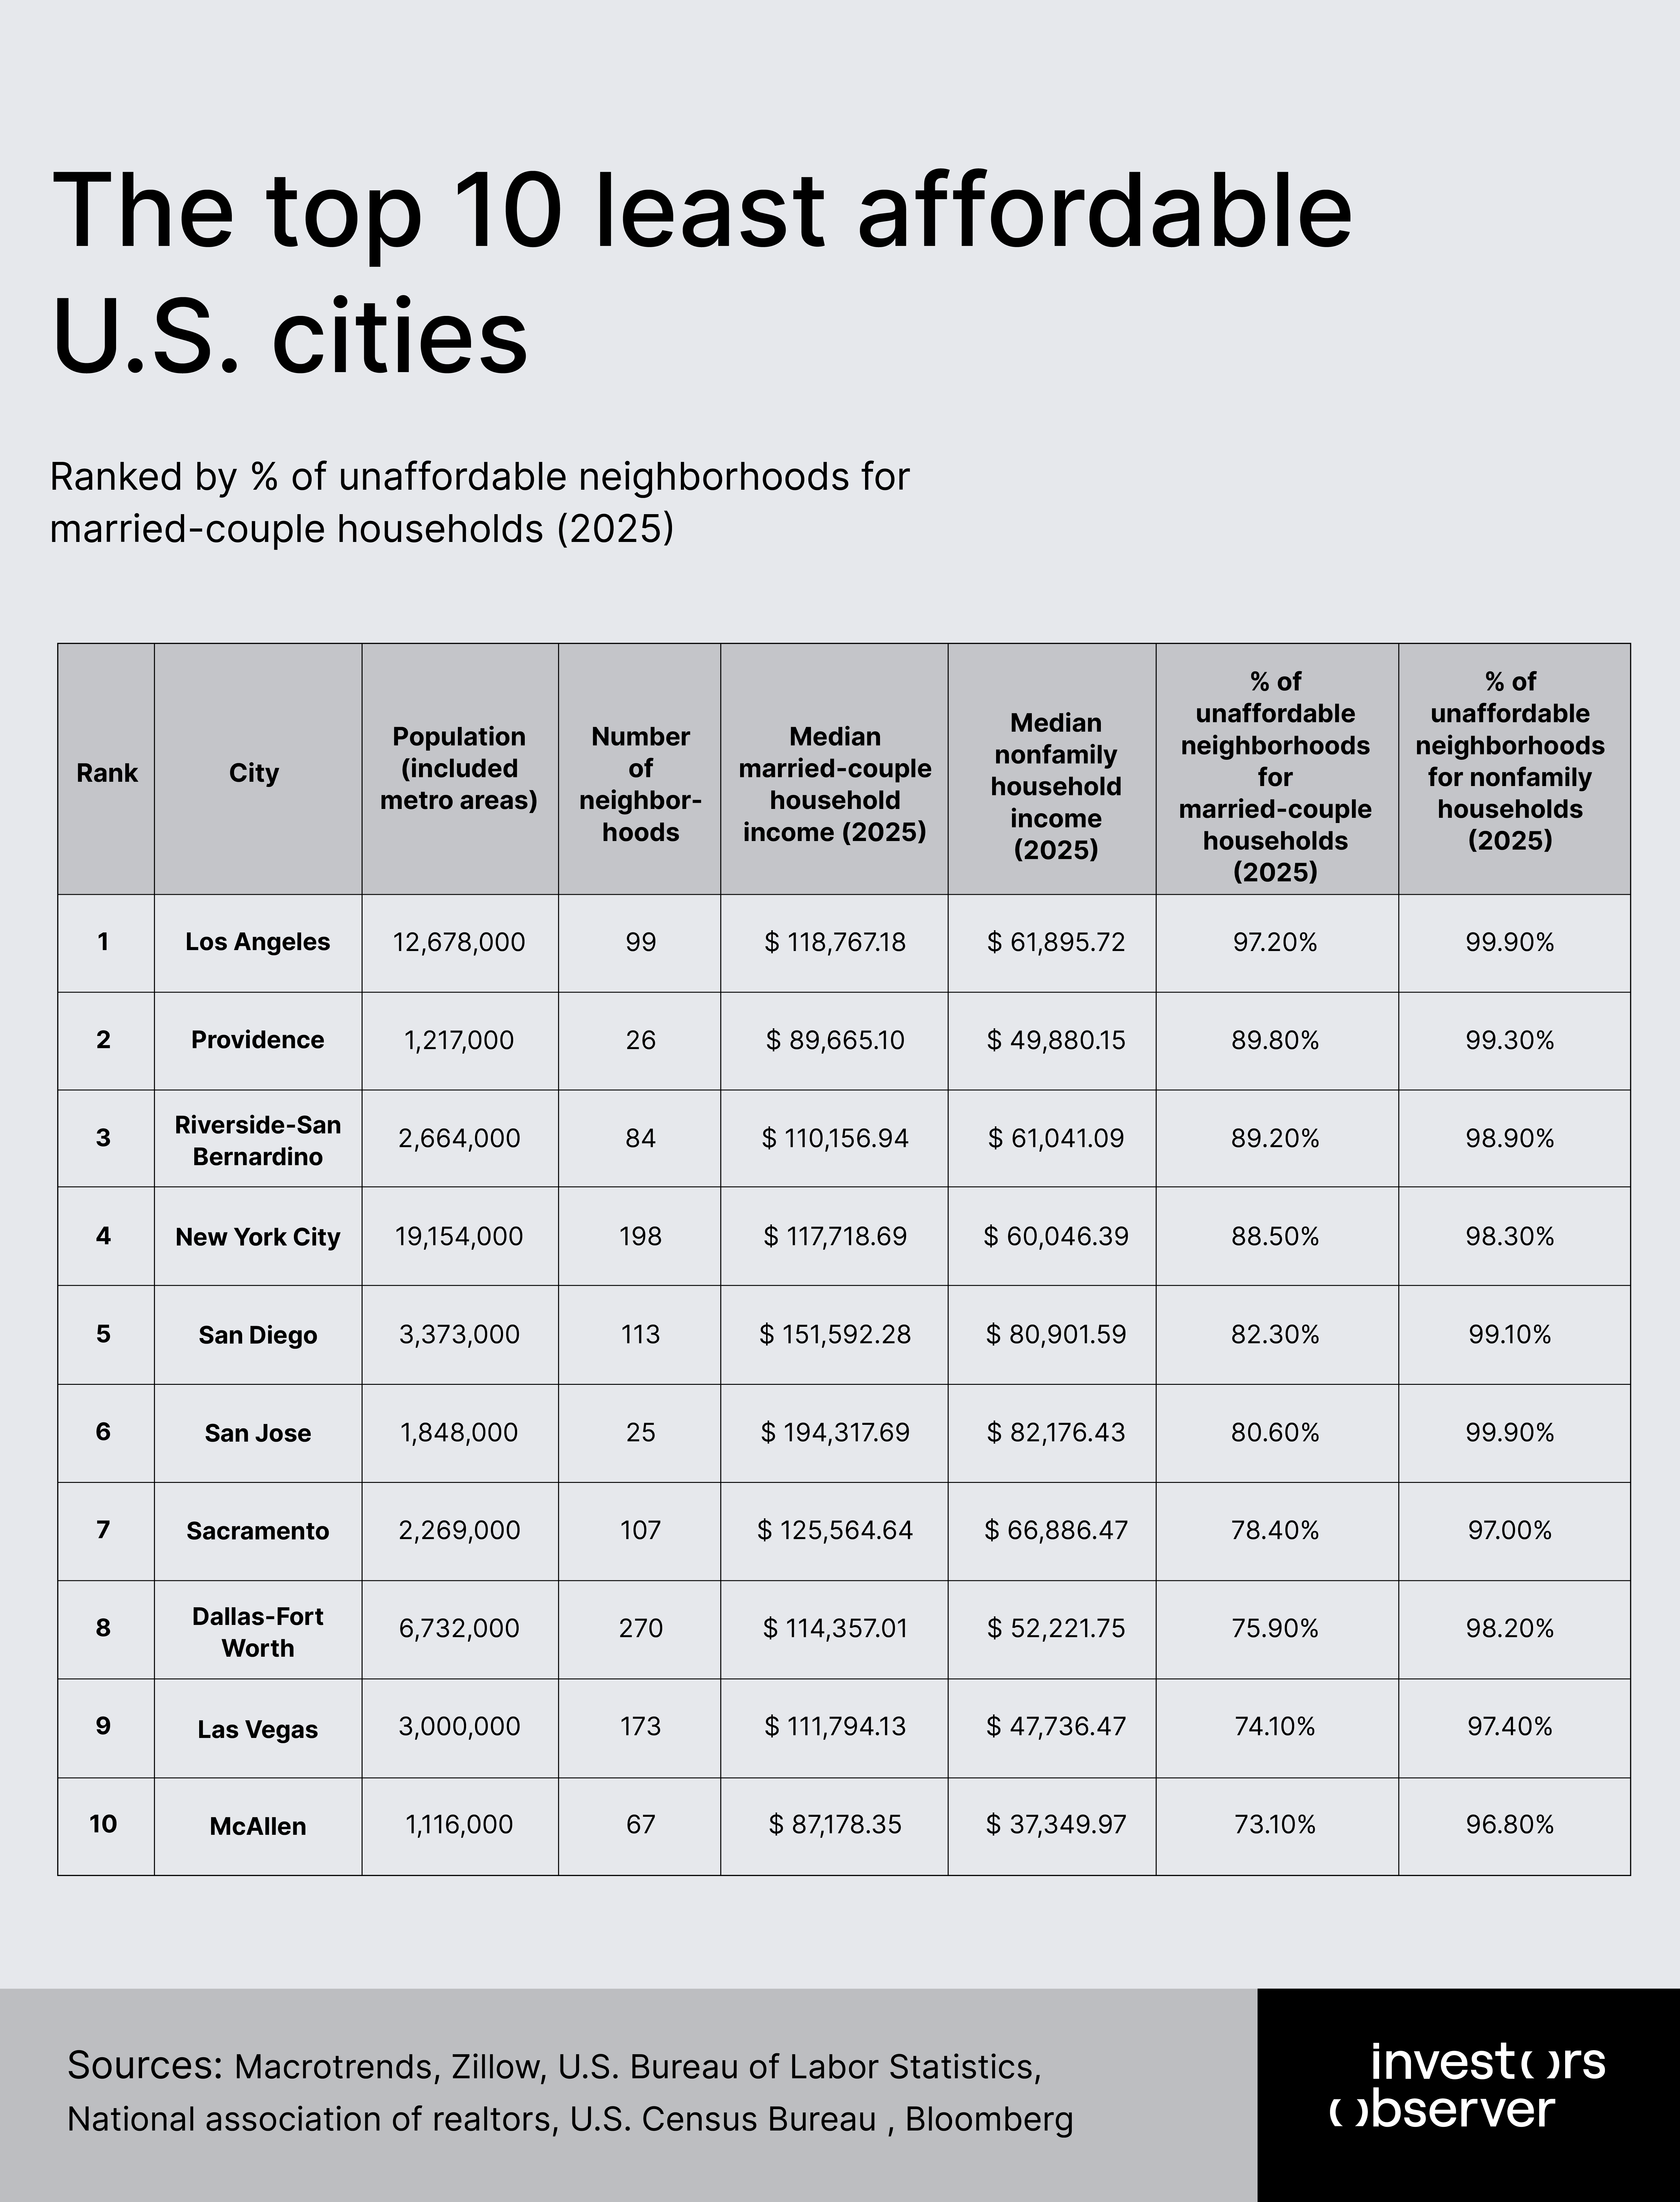
- The top three least affordable cities for married-couple households in 2025 are Los Angeles (97.2% unaffordable neighborhoods), Providence (89.8%), and Riverside-San Bernardino (89.2%).
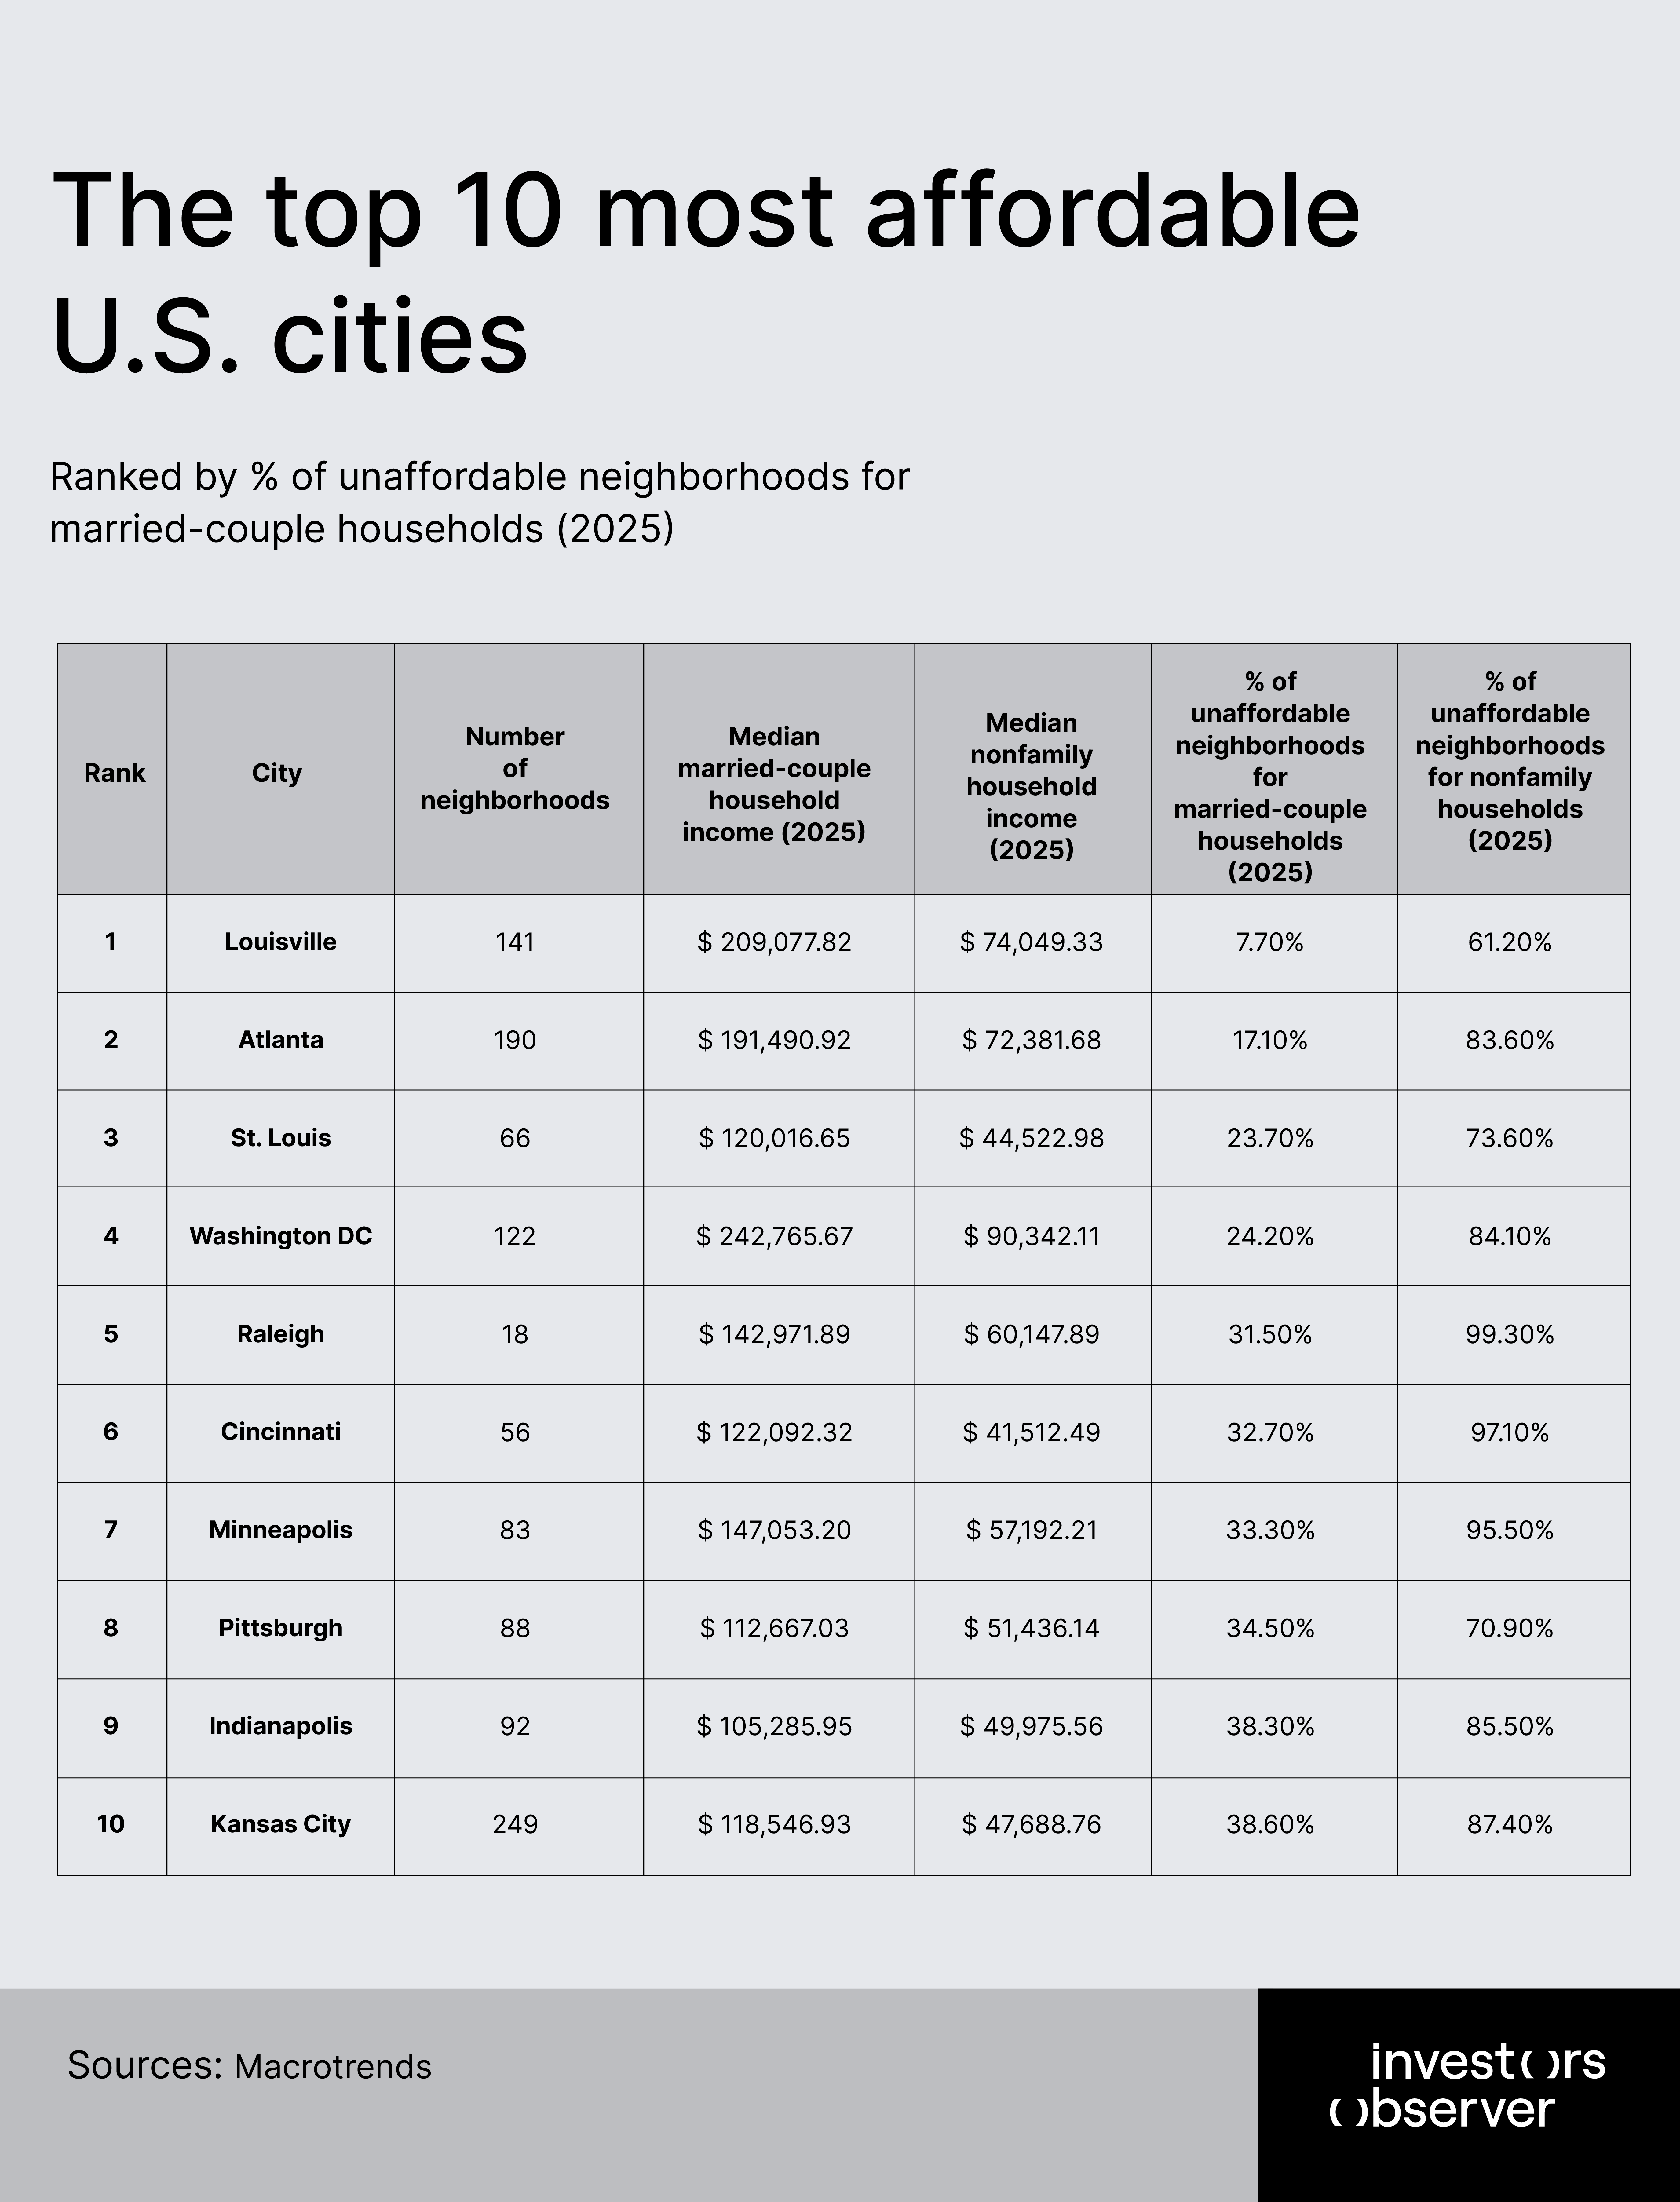
- The top three most affordable cities for married-couple households are Louisville (7.7% unaffordable neighborhoods), Atlanta (17.1%), and St. Louis (23.7%).
- In all top 10 least affordable cities for married couples, nonfamily households face unaffordability rates exceeding 95%, highlighting a stark affordability penalty for singles and nontraditional households.
- Cities with the sharpest spikes in unaffordability since 2019 (e.g., Providence, Riverside-San Bernardino, Las Vegas) show growing gaps between median married-couple income and median nonfamily income, exacerbating inequality.
- The number of “nowhere is affordable” cities has increased dramatically: in 2019, no city had over 80% of neighborhoods unaffordable for married couples. By 2025, nearly half do, sharply reducing geographic housing options.
- The pool of affordable metros for high-income families contracted sharply from 12 cities with below 10% unaffordability in 2024 to only Louisville remaining in 2025.
- While Los Angeles saw a slight improvement from full 100% unaffordability in 2024 to 97.2% in 2025 due to income growth outpacing price increases, several cities experienced dramatic spikes in unaffordability. Providence jumped 74.4 percentage points, Dallas-Fort Worth 58.5 points, signaling growing instability and housing market volatility.
The top 10 least affordable American cities for married couples in 2025
Housing affordability is predominantly worse for nonfamily households across all metros, reflecting income disparities and household composition.
The data also demonstrates a near-universal sharp increase in unaffordability since pre-COVID 2019, with some cities showing slight relief in 2025 versus 2024 due to income growth, while others face steep worsening conditions as housing costs continue to outstrip earnings.
This dynamic paints a challenging outlook for broad housing access across America’s largest urban centers.
Los Angeles
Los Angeles leads the nation in housing unaffordability, with 97.2% of neighborhoods unaffordable to median married-couple households in 2025. This represents a slight improvement from complete 100% unaffordability in 2024, illustrating some income growth offsetting relentless home price increases.
However, nonfamily households face near-total exclusion, with 99.9% unaffordability, revealing a harsher affordability crisis for singles or smaller households. Compared to the pre-COVID 2019 unaffordability level of 79.6%, Los Angeles has seen a steep 17.6-point increase, driven by surging home prices far outpacing income gains.
The median income for married couples in 2025 is roughly $118,767, compared to around $61,896 for nonfamily households, explaining the sharp disparity in unaffordability rates.
Despite some modest progress from 2024, Los Angeles remains the epicenter of housing stress, where nearly every neighborhood remains out of reach for most families and almost all nonfamily households.
Providence
Providence exhibits extreme housing unaffordability in 2025, with 89.8% of neighborhoods unaffordable to married couples, up substantially from just 15.4% in 2024. The jump suggests a rapid surge in housing costs overwhelming income growth, pushing the city into a serious affordability crisis.
For nonfamily households, the situation is more acute at 99.3% unaffordability, highlighting significant income disparities and a constrained market for singles.
The pre-COVID unaffordability was very low at 5.7%, signaling a profound shift over the pandemic and recovery years.
Median married-couple incomes rose to about $89,665 in 2025 but could not keep pace with the spike in housing costs. This dramatic shift makes Providence one of the fastest deteriorating housing markets on affordability metrics nationally, with implications for family stability and single household access to housing.
Riverside-San Bernardino
Riverside-San Bernardino registers 89.2% of neighborhoods unaffordable to married couples in 2025, a strong increase from 52.4% in 2024. Nonfamily households fare worse with 98.9% unaffordable neighborhoods, showing a pervasive market squeeze.
Pre-COVID 2019 levels were negligible at 0.5%, so this rapid rise marks a major affordability crisis fueled by surging home prices amid stagnant income growth.
Median married-couple income increased to around $110,157 by 2025, but housing price escalation overwhelmingly outpaced income gains.
This metro area’s rapid shift to widespread unaffordability highlights the geographic spread of housing stress beyond coastal metros to inland and suburban markets, contributing to growing economic displacement and access challenges.
New York City
New York City reports 88.5% of neighborhoods unaffordable for married-couple households in 2025, up from 85.9% in 2024 and a pre-pandemic level of 44.7%. Unaffordability for nonfamily households is even higher at 98.3%, consistent with higher income needs for marriage partners versus singles.
Median married-couple income in 2025 is approximately $117,719. NYC’s ongoing unaffordability stems from persistent housing supply shortages coupled with steep prices.
Though the city has long struggled with housing costs, the pandemic years have further exacerbated affordability pressures, increasing the share of unaffordable neighborhoods dramatically since 2019.
San Diego
San Diego remains severely unaffordable with 82.3% of neighborhoods unattainable for married couples in 2025, rising from 95.6% in 2024 – an improvement likely driven by income growth rather than price drops.
For nonfamily households, unaffordability is near universal at 99.1%. The jump since pre-COVID 2019 levels of 10.8% unaffordable neighborhoods reflects aggressive price increases well beyond income growth.
Median married-couple income reached about $151,592 in 2025, yet housing costs keep pace, sustaining a severe affordability crunch especially affecting single households.
San Jose
In San Jose, 80.6% of neighborhoods are unaffordable to married couples in 2025, down from 100% in 2024, showing modest progress possibly linked to wage growth. Nonfamily household unaffordability remains extreme at 99.9%.
Pre-COVID 2019 unaffordability was zero, indicating a massive jump over the pandemic period. Median married-couple income climbs to an outsized $194,318, the highest among the top 10, yet cannot match the significant rise in Bay Area housing prices.
This highlights a severe affordability challenge in one of the nation’s most expensive metro areas.
Sacramento
Sacramento experiences 78.4% unaffordable neighborhoods for married couples in 2025, a sharp rise from 42.99% in 2024 and 53.8% pre-COVID. Nonfamily household unaffordability is at 97%, indicating broad market pressures.
Median married-couple income of $125,565 in 2025 has not kept pace with housing cost inflation. The city’s growing unaffordability reflects spillover effects from coastal price pressures, creating challenges for families and individuals.
Dallas-Fort Worth
Dallas-Fort Worth reports 75.9% of neighborhoods unaffordable for married couples in 2025, a large jump from 17.4% in 2024. Nonfamily household unaffordability is 98.2%.
The pre-COVID 2019 level was under 1%, showing rapid escalation over six years. Median married-couple income at $114,357 in 2025 contrasts sharply with soaring home prices. This shows intensifying housing access issues in traditionally more affordable Texas markets.
Las Vegas
Las Vegas has 74.1% of neighborhoods unaffordable for married couples in 2025, increasing sharply from 16.2% in 2024 and from just 0.27% pre-COVID. Nonfamily households face 97.4% unaffordability.
Median married-couple income rose to about $111,794, yet dramatic home price gains outpace income growth, straining affordability in this fast-growing metro area.
McAllen
McAllen rounds out the top 10 with 73.1% of neighborhoods unaffordable for married couples in 2025, up from 17.9% in 2024 and 0.82% pre-COVID. Nonfamily households face 96.8% unaffordability.
Median married-couple income is relatively modest at $87,178, highlighting a critical affordability gap driven by rapid cost increases in smaller urban markets.
The top 10 most affordable American cities for married couples in 2025
The top 10 cities provide a glimpse into the most affordable large metropolitan areas for married-couple households in 2025.
While generally offering better affordability compared to coastal and rapidly growing metros, these cities are not immune to rising unaffordability trends – especially notable since 2024 and continuing the pattern observed since the pre-COVID era.
Despite relatively greater accessibility for married couples, nonfamily households in these areas consistently face steeper affordability challenges. This disparity is driven by significant income differences and stricter housing qualification criteria, highlighting enduring barriers to housing access.
Consequently, even cities deemed affordable still reflect the nationwide upward pressure on housing costs and the persistent struggles faced by singles and nontraditional households, emphasizing the complexity of housing access in contemporary America.
Louisville
Louisville is the most affordable city among the 50 largest U.S. metros in 2025, with only 7.7% of neighborhoods unaffordable for married-couple households. This marks a slight increase from 3.55% in 2024 but remains exceptionally low compared to many other metros.
Nonfamily households face higher unaffordability at 61.2%, reflecting the income gap between household types. Compared to pre-COVID 2019 levels of 0.71% unaffordability, the rise is modest, indicating stable and accessible housing markets for families over time.
Median married-couple income in 2025 stands at about $209,078, significantly higher than the nonfamily median of $74,049. This income strength supports broader geographic access to affordable housing.
Louisville’s affordability reflects a combination of relatively controlled home prices and strong household incomes without the extreme price surges experienced in coastal markets.
Atlanta
Atlanta reports 17.1% of neighborhoods unaffordable for married couples in 2025, up from 16.84% in 2024 – a minor increase showing steady but manageable affordability pressures.
Nonfamily households face much greater challenges, with 83.6% unaffordability, underscoring challenges for smaller or single households. Pre-COVID unaffordability was 11.16%, so the rise over the pandemic period is notable but less severe than in many cities.
Median married-couple income of $191,491 contrasts with $72,382 for nonfamily households, contributing to the margin in accessibility. Atlanta’s housing market reflects moderate price growth outpacing income gains for families but remains considerably more affordable than the pricey coastal metros.
St. Louis
St. Louis offers relatively broad affordability, with 23.7% of neighborhoods unaffordable for married couples in 2025, a substantive decline from 49.82% in 2024 indicating improved conditions likely driven by income growth or slowing home price increases.
Nonfamily households see 73.6% unaffordability, still significant but below many metros. Pre-COVID unaffordability was higher at 27.99%, meaning the city improved affordability compared to pre-pandemic levels.
Median married-couple income in 2025 is about $120,017 compared to $44,523 for nonfamily households. The city’s housing market benefits from moderately priced homes and stable income growth, contributing to a more accessible environment for families amidst national affordability challenges.
Washington, DC
Washington, DC shows 24.2% unaffordability for married couples in 2025, increasing from 17.21% in 2024 but still below many major metros. Nonfamily household unaffordability is significantly higher at 84.1%, reflecting income and market composition differences.
Pre-COVID 2019 unaffordability was 3.74%, indicating a substantial rise over six years but a market that remains more accessible for families than some peers. Median married-couple income reached $242,766 in 2025, the highest among these cities, supporting greater housing access despite high prices.
DC’s market reflects high demand and prices but also strong incomes providing relative advantage to families.
Raleigh
Raleigh records a 31.5% share of neighborhoods unaffordable for married households in 2025, up from 33.33% in 2024. Nonfamily household unaffordability is nearly universal at 99.3%.
The pre-COVID 2019 level of affordability was better at 3.53%, showing sharp increases amid rising prices. Median married-couple income is around $142,972, compared to $60,148 for nonfamily households.
Raleigh’s rising unaffordability reflects rapid growth and housing demand outpacing income rises, especially for singles, but still remains among the more affordable large metros for families.
Minneapolis
Minneapolis has 33.3% of neighborhoods unaffordable for married couples in 2025, slightly up from 2.41% in 2024, indicating significant recent pressure on housing affordability.
Nonfamily households face 95.5% unaffordability, much higher due to income differences. Pre-COVID data shows 0.8% unaffordability, confirming a sharp rise over the post-pandemic period.
Median married-couple income in 2025 is approximately $147,053 compared to $57,192 for nonfamily households. The city faces growing challenges from increased demand and price growth, but it remains more accessible for families than many U.S. metros.
Pittsburgh
Pittsburgh shows 34.5% unaffordability for married couples in 2025, a notable increase from 18.18% in 2024, indicating rising market pressure. Nonfamily households fare worse at 70.9%.
Pre-COVID unaffordability was 13.91%, so the rise is significant. Median married-couple income is about $112,667 versus $51,436 for nonfamily households. The housing market has seen growing price pressures outpacing incomes especially for singles, with some impact on family affordability.
Indianapolis
Indianapolis stands at 38.3% unaffordability for married couples in 2025, up from 4.35% in 2024 marking a steep affordability deterioration. Nonfamily households see 85.5% unaffordability.
Pre-COVID levels were zero, reflecting a substantial market shift. Median married-couple income is around $105,286 compared to $49,975 for nonfamily households. Increasing unaffordability reflects rising home prices and slowed income growth, notably pressuring access for nonfamily buyers.
Kansas City
Kansas City reports 38.6% unaffordability for married couples in 2025, up from 5.62% in 2024, showing a large increase in housing cost burden. Nonfamily household unaffordability stands at 87.4%.
Pre-COVID unaffordability was 0.61%, indicating dramatic escalation over six years. Median married-couple income is $118,547, substantially higher than the nonfamily median of $47,689. The city faces rapid price growth amidst stagnant earnings, reducing housing accessibility for many.
Oklahoma City
Oklahoma City has 39.4% of neighborhoods unaffordable for married couples in 2025, a large rise from 4.69% in 2024, reflecting sharply increasing housing costs. Nonfamily households have 87.3% unaffordability.
Pre-COVID unaffordability was 5.7%, so the city’s affordability eroded quickly. Median married-couple income is about $111,162, well above the $44,970 for nonfamily households. The rising unaffordability spots a rapid market change impacting both families and singles despite stable incomes.
2025 vs. 2024: America’s options for affordable housing continue to shrink
America’s options for affordable housing continue to shrink from 2024 to 2025, with the nation’s largest cities experiencing a widespread contraction in accessible neighborhoods for middle-income households.
In 2024, a notable 12 of the top 50 cities had unaffordability rates below 10%, representing a meaningful segment where homeownership remained attainable for median married-couple households.
By 2025, that figure has dropped drastically, with only Louisville maintaining an unaffordability rate less than 10%. This stark decline reveals a shocking erosion of affordability, even for high earners, across metropolitan America.
The data reveals a nuanced shift at the most unaffordable end of the scale as well. In 2024, multiple cities – including Los Angeles and several major Northeast and West Coast metros – reported 100% of neighborhoods unaffordable for the median married-couple household.
By 2025, no major city posts a full 100% unaffordable, as subtle income gains have modestly re-opened access in a tiny fraction of neighborhoods. Yet, this should not be mistaken for meaningful improvement. Los Angeles, for instance, only fell to 97.2% unaffordable, and the vast majority of urban cores remain effectively out of reach for average families.
The composition of the least and most affordable cities also changed. In 2024, the five most unaffordable cities were Los Angeles, Boston, San Jose, San Francisco, and New York.
One year later, Providence and Riverside–San Bernardino have overtaken Boston and San Francisco in the top five, revealing how rapidly unaffordability can escalate in rising-market regions, not just legacy “expensive” hubs.
Meanwhile, among the most affordable cities, 2024’s standouts of Hartford, Memphis, and Cleveland have been replaced by Louisville, Atlanta, and St. Louis, showing shifting regional patterns in affordability as well as possible local interventions, income shifts, or housing market dynamics.
Ultimately, while there are small pockets of mild improvement – driven, in most cases, by wage growth marginally outpacing home price appreciation in a handful of neighborhoods – the broad story remains unambiguous.
The share of unaffordable city neighborhoods soared in 2025 compared to the year prior. This cumulative effect compounds affordability challenges for families and singles, reinforcing that the options for accessible homeownership in America’s largest cities are dwindling faster than at any prior point in the post-pandemic era.
Methodology
Percentage of unaffordable neighborhoods
To determine the percentage of unaffordable neighborhoods in each city, we looked at the median income of married-couple households in each city from the end of 2023 and adjusted it for real wage growth from 2024 till 2025.
Then, we examined the typical value of a home in more than 5,800 neighborhoods across the largest 50 cities and estimated how many of these neighborhoods are affordable for the median-earning family in the city.
Neighborhoods were deemed unaffordable if monthly mortgage payments (interest and principal) on an average home in the neighborhood exceeded 25% of the average married-couple household’s gross income.
The following mortgage variables were used in our analysis:
- 2024: down payment: 20%, 30-year fixed-rate mortgage interest rate: ~6,5%
- 2019: down payment: 20%, 30-year fixed-rate mortgage interest rate: 3.8%
- The typical value of a home in each neighborhood was sourced from a smoothed, seasonally adjusted version of the Zillow Home Value Index (ZHVI). It reflects the typical value for homes in the 35th to 65th percentile range.
Married-couple household income
To calculate the average married-couple household income, we compiled 2023 median married-couple household income data in each of the 50 cities and adjusted it for 1.5% real wage growth during 2024 and the beginning of 2025.
Home prices in our study are seasonally adjusted.
Limitations
Only neighborhoods with a statistically significant sample of housing data were used in the study. Therefore, the number of neighborhoods presented may not align with the official count of neighborhoods in each city.
Sources
- Macrotrends
- Zillow
- U.S. Bureau of Labor Statistics
- National association of realtors
- U.S. Census Bureau
- Bloomberg
Your email address will not be published. Required fields are markedmarked