The top 10 states where Americans trade the least workdays for rent, food, and a used car

The affordability crisis gripping America is typically measured in percentages and price indexes. But it can really be translated into one practical question: how much of my life am I trading just to survive?
InvestorsObserver’s analysis of wage and living cost data from 2007 to 2025 across all 50 U.S. states reveals where Americans are winning this fight today, and where workers have held their ground against inflation.
The 18-year timeframe captures the last normal year before the Great Recession through today’s post-pandemic economy, showing exactly how much harder it’s become to afford the basics.
By measuring affordability in workdays rather than dollars, this report identifies the top 10 states where paychecks stretch furthest, where rising costs haven’t stolen as much time, and where the essentials of middle-class life remain within reach.
The metric is straightforward: how many eight-hour workdays must someone work to afford three non-negotiables – annual rent for a one-bedroom apartment, a year’s worth of groceries, and saving for a used car?
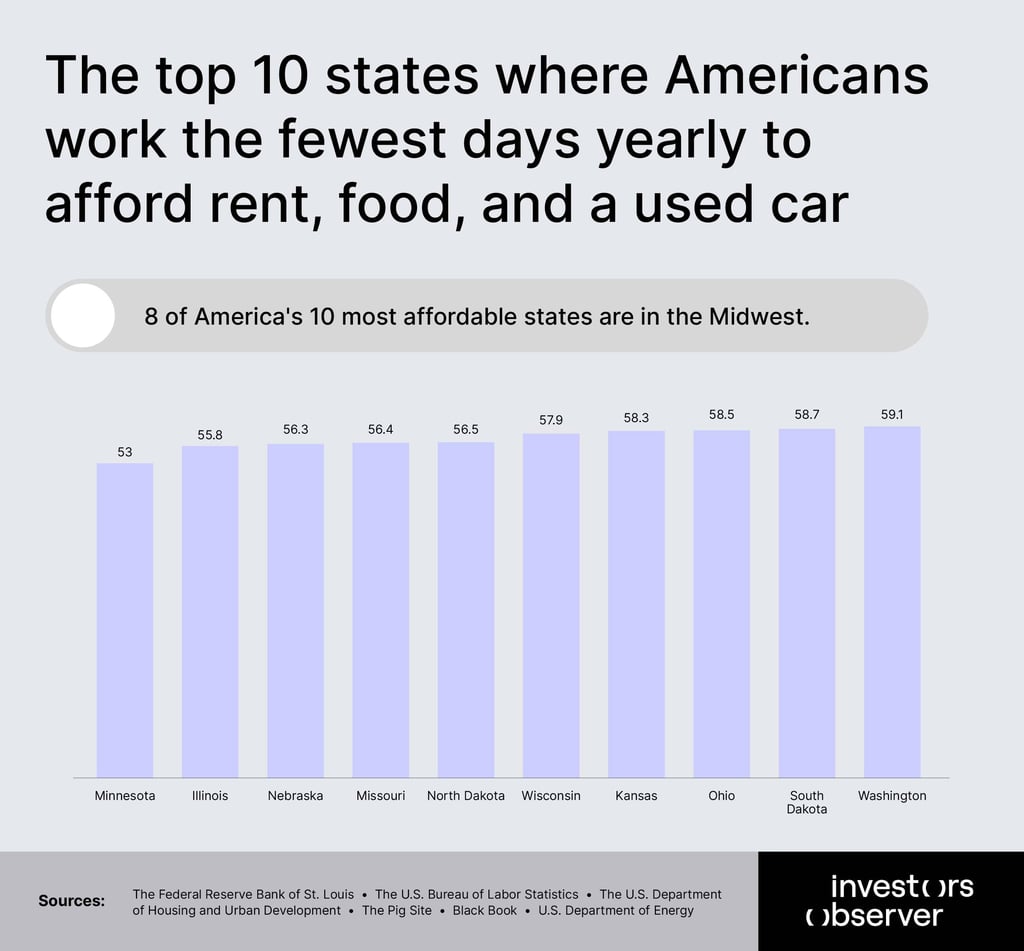
In the best-performing state, that answer is just 53 days a year, or 4.4 workdays a month. These top 10 states have managed what much of America could not: preserve a livable balance between earnings and expenses.
Key findings
- 8 of America's 10 most affordable states are in the Midwest, as basic coastal living is costing you weeks of your life.
- Minnesota workers need just 53 days of work to cover rent, groceries, and save for a used car – fewer than any state in America.
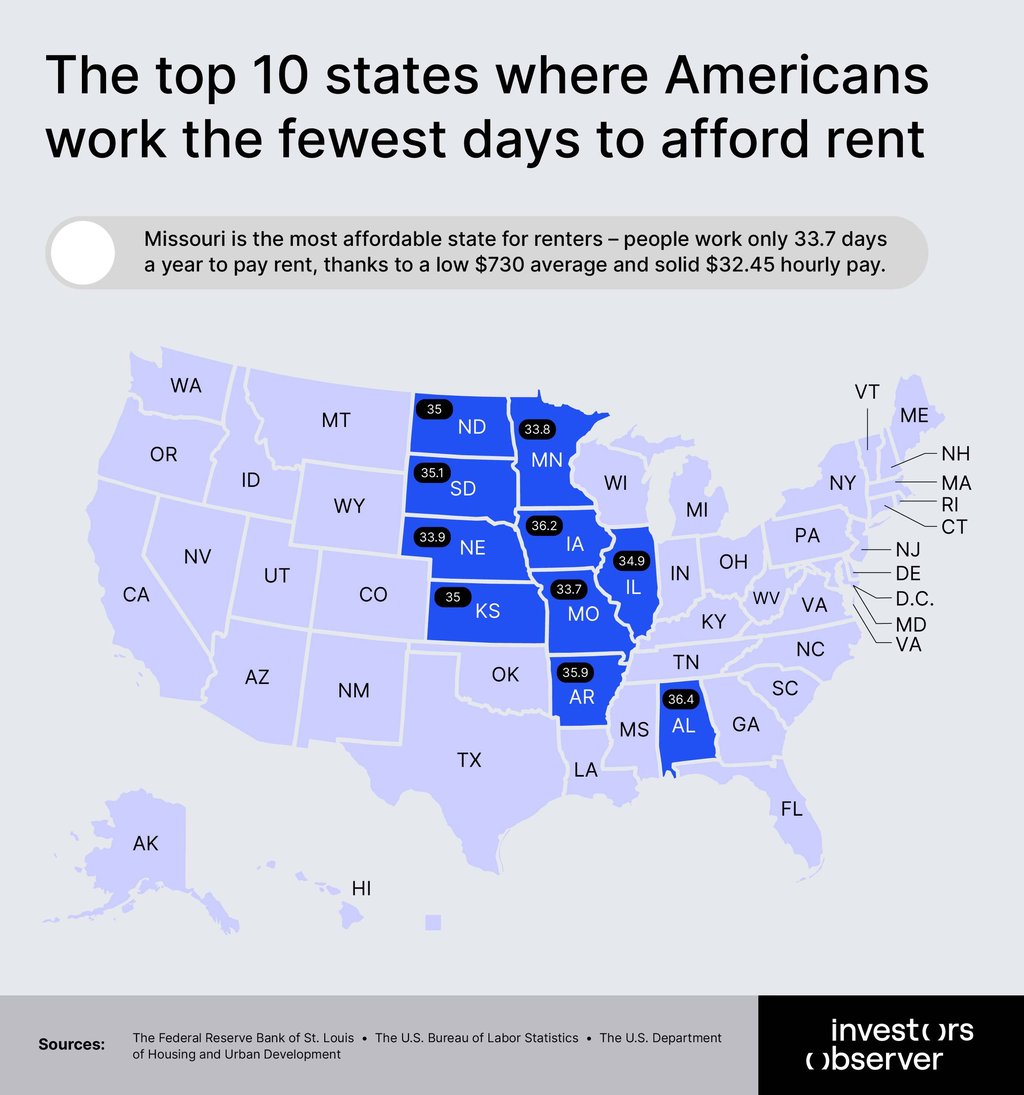
- Missouri is the most affordable state for renters – people work only 33.7 days a year to pay rent, thanks to a low $730 average and solid $32.45 hourly pay.
- Only three states – South Dakota, North Dakota, and Wisconsin – appear in both the top 10 for smallest time increases and the top 10 for fewest total workdays needed.
Since 2007, most of the country has watched this balance collapse. Workers nationwide now sacrifice significantly more days each year for the same basics.
High-wage coastal cities don’t dominate the rankings. Instead, a coalition of Midwestern states and strategic outliers have created something increasingly rare: places where hard work still translates to a life beyond survival, where time remains your own, where 53 days of work can secure a year’s worth of basic security.
“The data challenges the narrative that workers need to chase coastal salaries to get ahead. What matters isn’t how much you earn – it's how much of your life you get to keep,” said Sam Bourgi, senior analyst at InvestorsObserver.
The rankings that follow map where opportunity still exists, and show where Americans can build a life, not just a living.
1. Minnesota: 53 workdays
Workers need just 53 workdays annually – the lowest in America. With $38.25/hour wages (second-highest in top 10) and $862 monthly rent, Minnesota combines strong earnings with moderate housing costs.
Since 2007, workers need 7.9 extra workdays – a significant increase, but wages grew 61.8% from $23.6 to $38.3/hour, buffering cost pressures.
Minnesota’s diversified economy (healthcare, finance, manufacturing) sustains high wages while keeping rent below $900. Annual costs break down to $10,344 rent, $1,993 used car savings, and $3,881 groceries, totaling $16,218.
2. Illinois: 55.8 workdays
Illinois workers need 55.8 workdays with $35/hour wages and $814 monthly rent. Despite Chicago metro area housing pressures, Illinois ranks second nationally.
Hourly wages jumped 54.7% since 2007 ($22.6 to $35), while rent increased 73.2% ($470 to $814).
Workers need 8.8 extra workdays versus 2007. The state’s robust urban economy (finance, technology, healthcare, logistics) drives above-average wages for affordable states.
Total annual cost: around $16,149. Illinois proves metropolitan areas can maintain affordability through strong job markets that support middle-class earnings.
3. Nebraska: 56.3 workdays
Nebraska requires 56.3 workdays at $32.8/hour with $741 monthly rent – among the lowest rents in top 10. Workers need just 5.5 extra workdays since 2007, the third-smallest increase nationally.
Wages rose 64.5% while rent grew 70%, creating near-equilibrium growth. Nebraska’s diversified economy (agriculture, manufacturing, transportation) provides consistent wage growth tracking living costs.
Total annual cost: around $15,599. This stability makes Nebraska exceptionally predictable for household budgeting. This offers financial consistency rare in modern America.
4. Missouri: 56.4 workdays
Missouri workers need 56.4 workdays with America's second-lowest rent at $730 monthly and $32.5/hour wages.
Since 2007, workers need 6.6 extra workdays – moderate compared to coastal states. Wages increased 64% while rent rose 74.6%.
Missouri’s combination of below-average housing costs and solid middle-income wages creates exceptional affordability. Total annual cost: around $15,553.
Cities like Kansas City and St. Louis provide urban amenities without extreme cost pressures, making Missouri ideal for working families seeking affordable metro living.
5. North Dakota: 56.5 workdays
North Dakota requires 56.5 workdays despite 93.5% rent increases since 2007, thanks to 86.4% wage growth – second-highest nationally.
Workers earn $34.2/hour with $798 monthly rent, needing just 3.2 extra workdays since 2007 (second-smallest increase).
Between 2007 and 2025 the wages were transformed from $18.3 to $34.2/hour. Total annual cost: around $15,569.
While energy sector growth inflated housing costs, corresponding wage increases created a high-cost, high-wage equilibrium maintaining affordability ratios better than most states.
6. Wisconsin: 57.9 workdays
Wisconsin workers need 57.9 workdays at $34.3/hour with $832 monthly rent. Wages grew 69% since 2007 while rent increased 76.6%, requiring 5.30 extra workdays annually.
Wisconsin’s economy (manufacturing, agriculture, healthcare, tourism) generates stable wage growth closely tracking housing costs.
Total annual cost: around $16,765. Cities like Milwaukee and Madison balance urban job opportunities with adequate housing supply, preventing affordability crises.
7. Kansas: 58.3 workdays
Kansas requires 58.3 workdays with $735 rent and $31.5/hour wages. Workers need 7 extra workdays since 2007 as wages rose 61% and rent grew 70.9%. Total annual cost: around $15,591.
Kansas maintains affordability through balanced growth across agriculture, aviation manufacturing (Wichita), and healthcare sectors.
Low population density keeps housing supply adequate, preventing rent explosions seen in high-growth states.
“Kansas proves sustainable development can preserve affordability while supporting reliable wage increases,” explained Bourgi.
8. Ohio: 58.5 workdays
Ohio workers need 58.5 workdays at $33.2/hour with $807 monthly rent. Since 2007, workers need 5.7 extra workdays as wages increased 64.4% and rent rose 70.6%.
Total annual cost: around $16,430. Ohio’s manufacturing resurgence, healthcare expansion, and logistics growth (Amazon, FedEx hubs) sustain middle-class wages.
Abundant housing stock from legacy cities (Cleveland, Cincinnati, Columbus) prevents severe rent inflation.
9. South Dakota: 58.7 workdays
South Dakota requires 58.7 workdays with $729 rent and $31.2/hour wages, needing just 1.7 extra workdays since 2007 (smallest increase in top 10).
Wages surged 85.4% while rent rose 82.7%, with earnings outpacing housing costs. Total annual cost: around $15,491.
This extraordinary stability stems from balanced economic development (tourism, finance, healthcare) that boosted incomes without triggering speculative housing inflation.
“South Dakota proves wage growth can nearly match living costs when policy and market forces align,” explained Bourgi.
10. Washington: 59.1 workdays
Washington requires 59.1 workdays (most in top 10) but qualifies through the highest wages at $41.8/hour. Monthly rent averages $1,157 (much higher than other top-10 states).
Workers need 11.8 extra workdays since 2007 (highest increase). Rent skyrocketed 115.5% while wages grew 69.6%.
Total annual cost: around $20,837. Seattle’s tech boom (Amazon, Microsoft) and aerospace sector (Boeing) drive exceptional wages offsetting severe housing inflation.
Time saved since 2007 and actual affordability today: only 3 states pulled off a double win
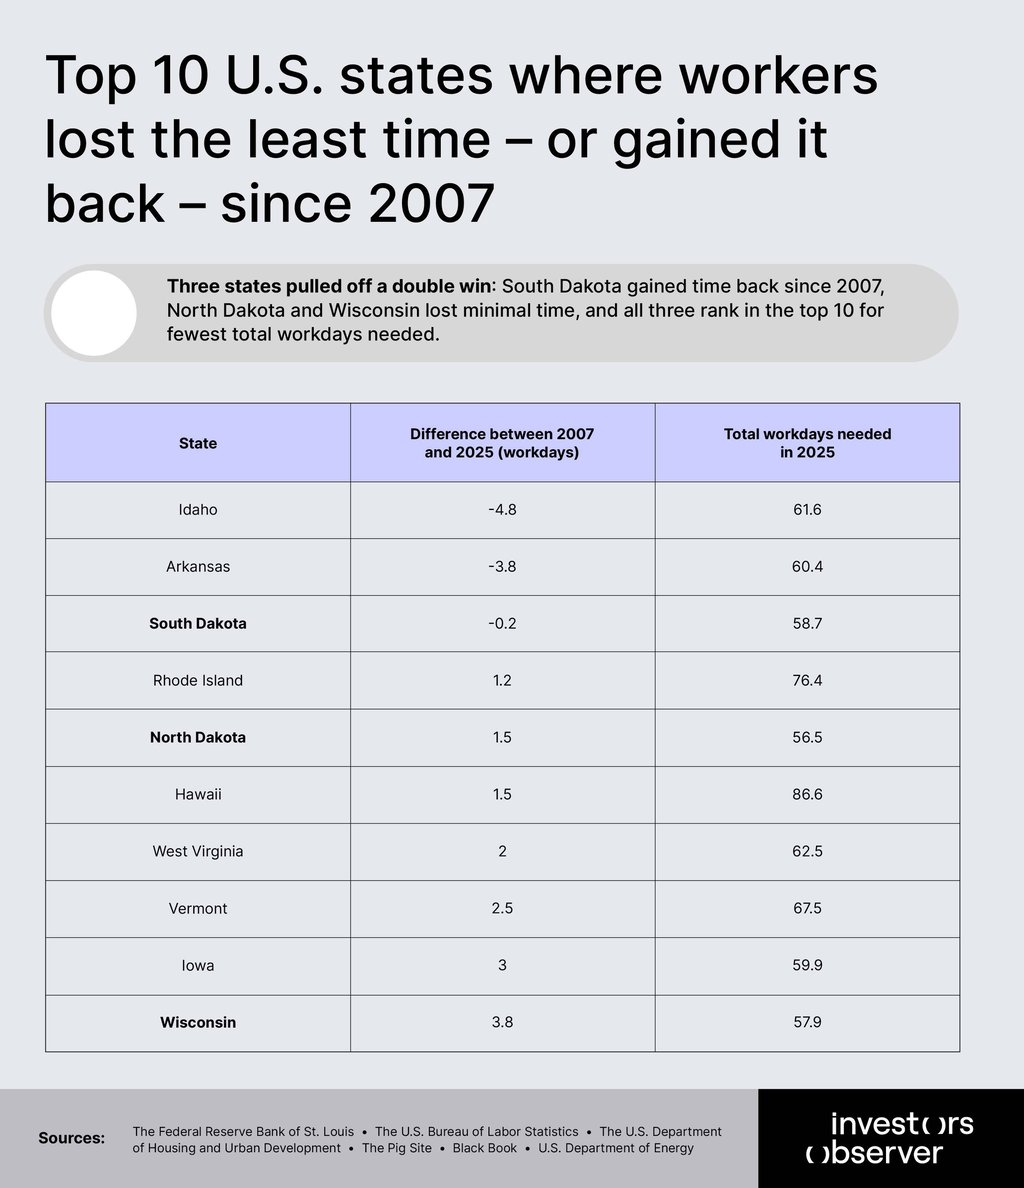
In terms of the difference between workdays needed in 2007 and now, Idaho and Arkansas appear to be the success stories.
Workers in these states actually need fewer workdays in 2025 than they did in 2007 – a rare reversal in an economy where everyone else is treading water or drowning.
Idaho workers gained 4.8 days back, while Arkansas workers reclaimed 3.8 days. It sounds like victory.
Idaho workers gained 4.8 days back, while Arkansas workers reclaimed 3.8 days. It sounds like victory.
But look at the second column. Idaho workers still need 61.6 days to cover annual basics, while Arkansas requires 60.4 days.
Compare that to North Dakota (56.5 days) or Wisconsin (57.9 days), and the picture shifts.
These states made impressive progress relative to their own past, but they're not the most affordable places to live today. Improvement doesn't equal excellence.
A student who raises their grade from a D to a C improved more than one who maintained an A-minus, but you'd still rather have the A-minus.
The same paradox appears at the expensive end. Hawaii and Rhode Island show stability, adding just 1.5 and 1.2 extra workdays since 2007.
In an era when most states hemorrhaged 5 to 12 days, that's impressive resilience. But workers in Hawaii need 86.6 days annually, while Rhode Island demands 76.4 days.
That's 20 to 30 more workdays than the true affordability leaders requiring the least time for the basics today.
The real winners are the states that appear in both categories: South Dakota, North Dakota, and Wisconsin.
South Dakota workers need just 58.7 total days and lost virtually no time since 2007 (0.2 days).
North Dakota requires 56.5 days with only a 1.5-day increase. Wisconsin needs 57.9 days despite a 3.8-day rise.
South Dakota, North Dakota, and Wisconsin offer the double advantage that matters for long-term planning – they're affordable now, and they’ve protected workers from the worst inflation damage.
“For anyone considering relocation, career changes, or investment decisions, this distinction is critical. The question isn’t just “where am I gaining ground?” but “where does my paycheck actually go furthest today?” A state trending in the right direction but starting from a high baseline still costs you more life than a consistently affordable state. The data shows that true opportunity exists where low total burden meets proven resilience, and in 2025, that sweet spot sits squarely in the Upper Midwest,” said Bourgi.
Methodology and sources
We calculated workdays needed using government and industry data, comparing 2007 to 2025 on consistent terms.
Hourly earnings:
- Federal Reserve Bank of St. Louis (FRED) for 2007
- Bureau of Labor Statistics (BLS) for March 2025
Rent:
- Department of Housing and Urban Development’s (HUD) annual Fair Market Rents for one-bedroom units across 2,000+ U.S. regions
Used cars:
- Black Book (2025)
- Department of Energy (2007)
Groceries:
- Fixed basket of 12 staples (milk, eggs, bread, meat, produce) cost $43 in 2007 per The Pig Site
- Adjusted for 74% inflation via FRED CPI to $75 in 2025
Workdays assume an 8-hour day. Percentage changes and net differences (wages vs. costs) complete the view.
The “extra workdays per year” figure combines:
- Recurring annual expenses (rent, groceries)
- Savings for a used car calculated based on the average age of vehicles in the U.S. in 2007 and 2025
In 2007, the average age of vehicles in the U.S. was 9.2 years, according to R. L. Polk & Co. In 2025, the average age of vehicles in the U.S. was 12.8 years, as reported by S&P Global.