
The American dream has never been static, but in 2025, owning a home – once key to middle-class life – is harder to achieve than ever.
For decades, buying a home meant stability, mobility, and belonging. Now, amid record-high prices and stagnant wage growth, that benchmark drifts farther out of reach for millions.
Fresh research by the InvestorsObserver’s team reveals a difficult situation. While scattered metro areas still offer genuine affordability, most of the country is dealing with a new reality, one in which the math simply doesn’t add up.
Income gains fail to keep pace with the relentless escalation of housing costs, creating widening gaps between aspiration and access.
In this report, covering the nation’s 100 largest metropolitan regions, we map out the contours of this crisis and trace the regional disparities shaping who can – and can’t – claim a piece of the American promise.
Key findings
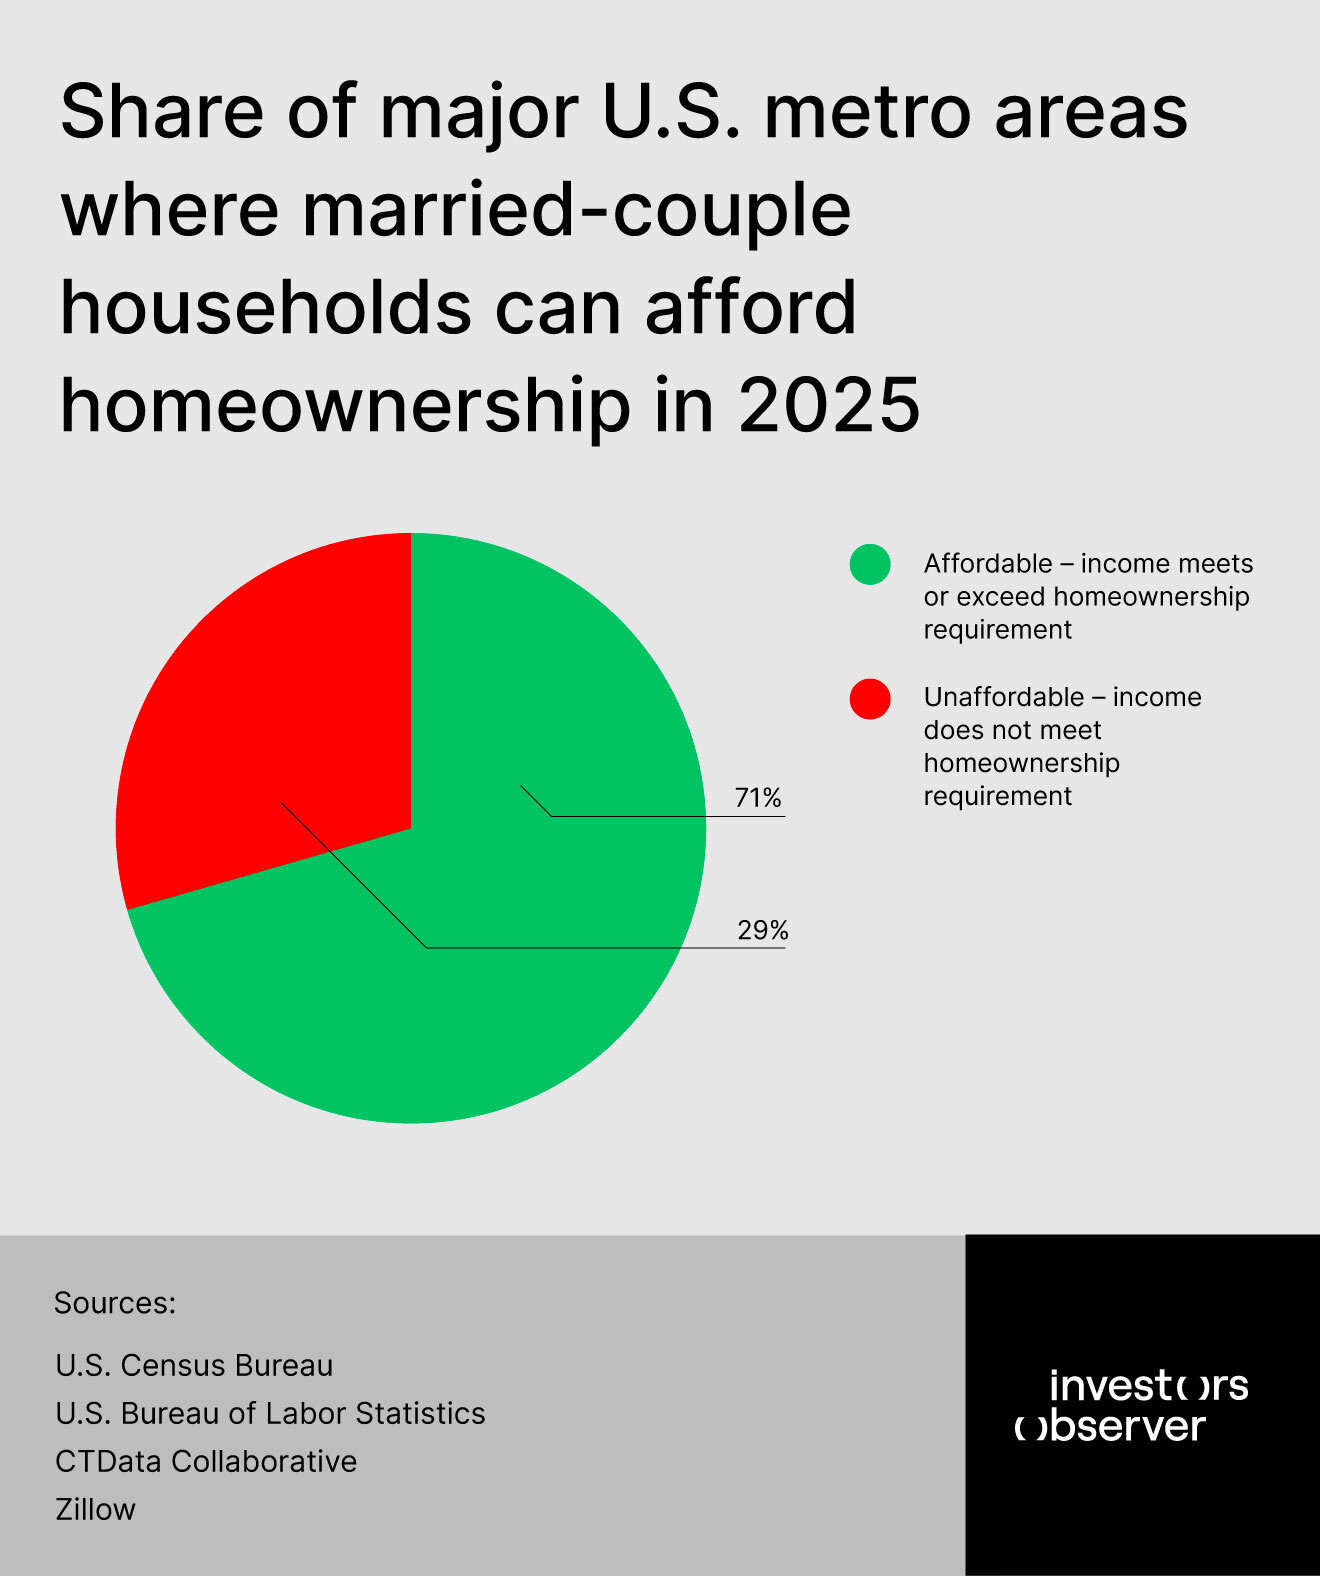
- Among the 100 largest U.S. metros, 71 have median married-couple household incomes sufficient to meet qualifying income levels required for purchasing a typical home in 2025. 29 metros fall short, indicating severe affordability gaps.
- Louisville, Kentucky stands out as the most affordable metro where median married-couple income ($209,078) far exceeds the qualifying income needed ($73,377) for homeownership, despite average home prices near $255,000.
- In major coastal metros such as Washington, DC, and Atlanta, high median incomes (above $190,000 in Atlanta, $242,766 in DC) still support homeownership amidst higher home prices, underscoring the importance of income strength.
- Conversely, some large metros with lower median incomes such as Jackson, Mississippi ($108,048) and Columbia, South Carolina ($126,764) remain relatively affordable due to much lower home prices (e.g., Jackson's average home price approx. $78,000).
- Median home prices vary widely across metros from under $80,000 in Jackson to over $600,000 in Washington, DC, driving disparate affordability dynamics.
- Real wage growth is modest (1.4% increase from 2024 to 2025), insufficient by itself to keep pace with rapid home price appreciation in many markets, exacerbating the middle-class affordability squeeze.
The top 10 most affordable metro areas in 2025
The top 10 most affordable metropolitan areas in 2025 present a hopeful counter-narrative to the widespread housing affordability crisis gripping much of the United States.
In these markets, median married-couple household incomes substantially exceed the income levels required to qualify for mortgages on typical homes, easing the financial burden on middle-class families.
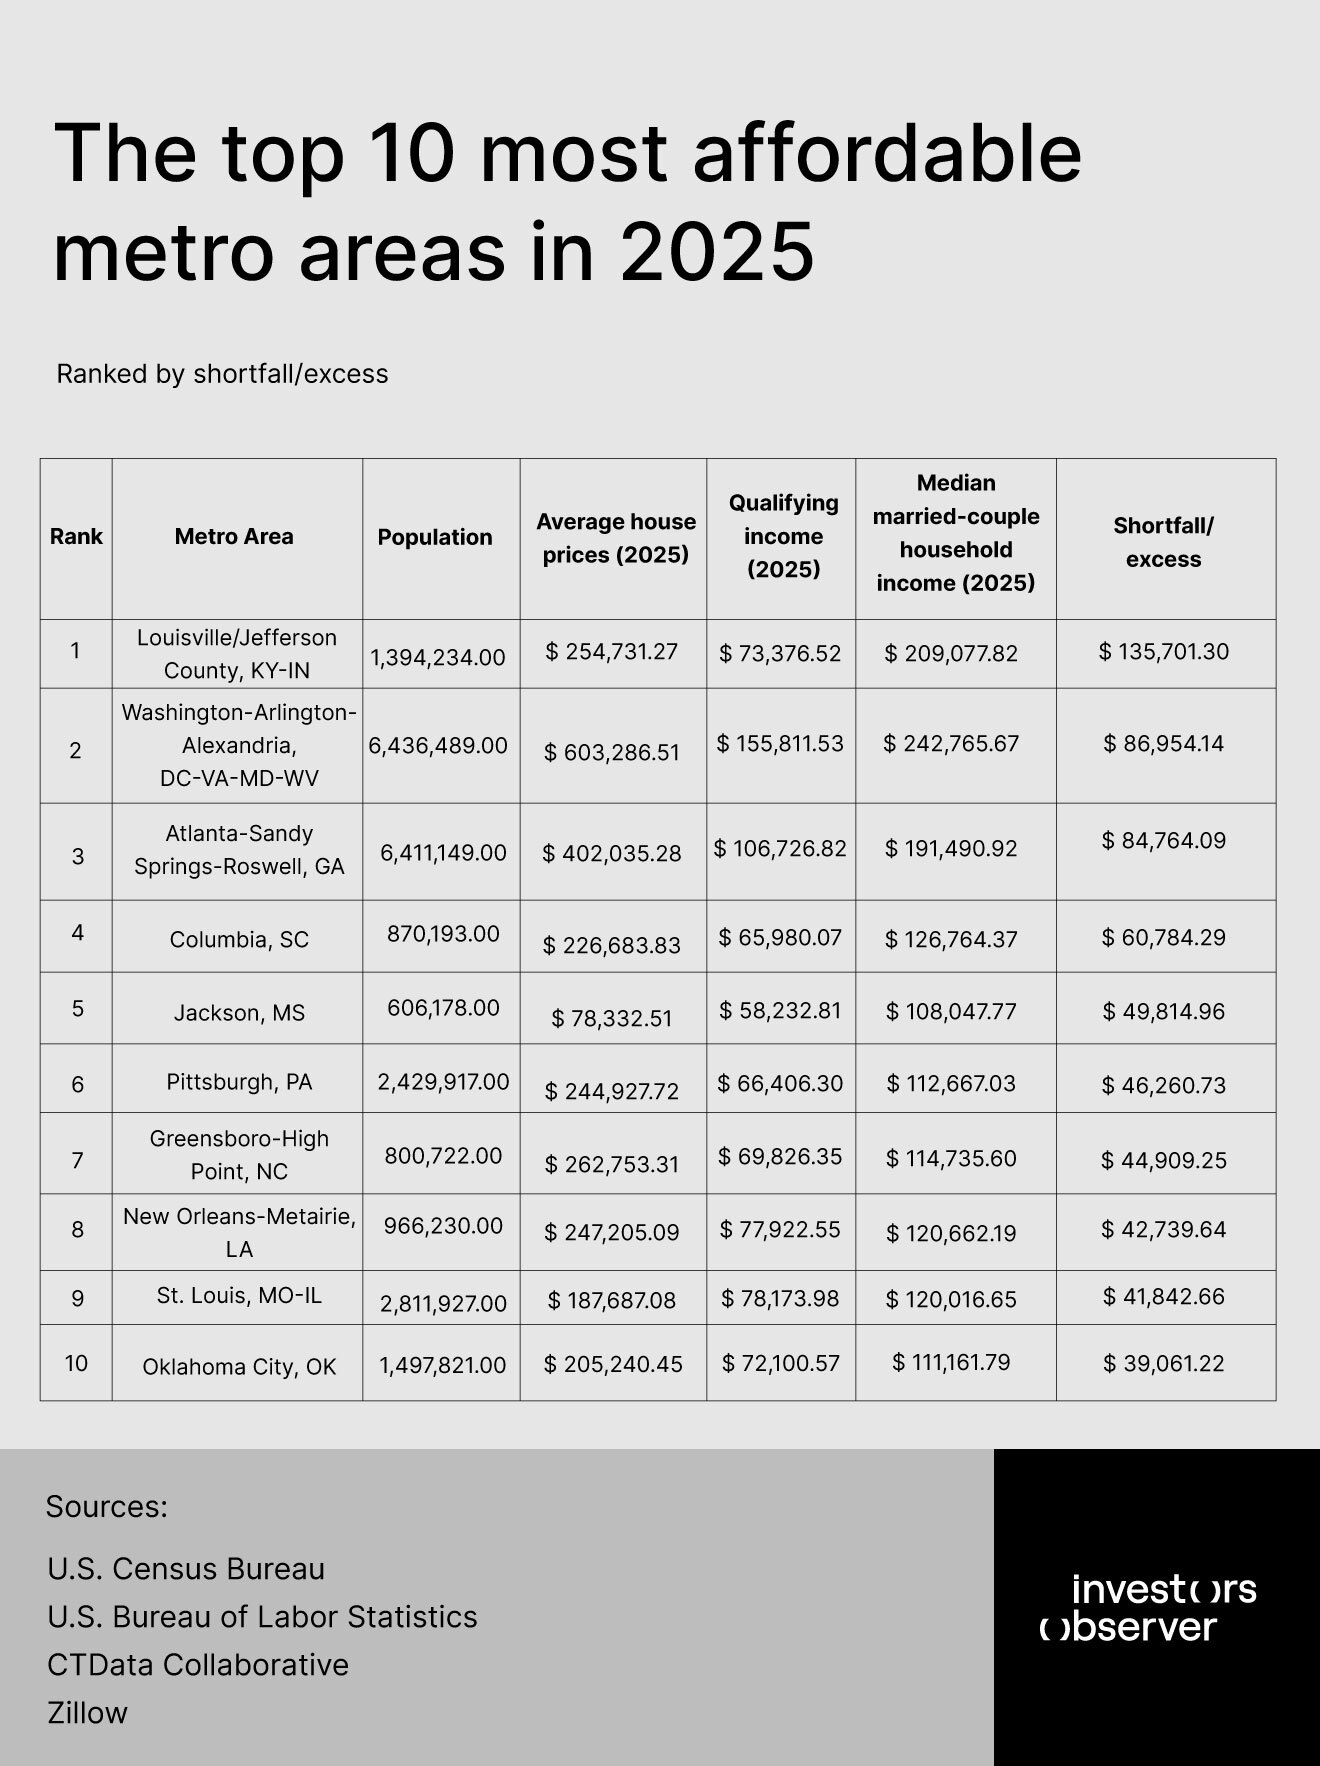
1. Louisville/Jefferson County, KY-IN
Louisville is the most affordable metro area in an otherwise tightening American housing market in 2025. With an average home price near $255,000 and a qualifying income requirement just above $73,000, Louisville’s median married-couple household income exceeds that threshold by over $135,000.
This remarkable margin signals a uniquely accessible market where the middle class can still realistically pursue homeownership. The city’s population of roughly 1.4 million enjoys a balance rarely seen today: steady income growth paired with reasonably priced housing.
Louisville’s affordability is grounded in stable property values that, unlike coastal metros, have not surged uncontrollably. This stability anchors economic security for families, allowing them the chance to build wealth through homeownership without the crushing burden of unsustainable mortgage payments.
Louisville also exemplifies how mid-sized metros can offer paths to economic mobility by providing a living environment supportive of family formation and financial resilience. Despite nationwide challenges of price spikes and wage stagnation, Louisville’s market reinforces the notion that affordability is less an inevitable casualty of the housing crisis and more a consequence of local economic conditions and policy choices.
2. Washington-Arlington-Alexandria, DC-VA-MD-WV
Washington’s metro area delivers a striking portrait of how deep pockets can clash with steep home prices yet still preserve affordability for the well-earning married couple. Despite a daunting average home price exceeding $600,000, the region’s median married-couple income surpasses $240,000 – a powerful income cushion that outstrips the qualifying income requirement by nearly $87,000.
This income strength in the nation's capital and surrounding areas shields many families from the full brunt of the housing crisis, allowing continued access to homeownership in a market defined by restricted supply and high demand.
The area's diverse economy, with influential government, tech, and professional sectors, fuels incomes that keep pace with elevated living costs. Yet, even here, the affordability story is nuanced. Singles, renters, and lower-earning households face obstacles, given that the affordability assessment centers on married-couple incomes.
Washington’s experience highlights a dual narrative: affluence preserves access for some, while others remain increasingly marginalized. This dynamic serves as a microcosm of the nation’s broader housing debate – where income inequality intersects sharply with skyrocketing urban home prices, underscoring the limits of income growth as a sole solution.
3. Atlanta-Sandy Springs-Roswell, GA
Atlanta represents a compelling hybrid of rapid growth and balanced affordability in 2025. The metro’s median married-couple household income of about $191,000 comfortably surpasses the qualifying income needed for its $400,000 average home price by nearly $85,000.
This substantial excess underlines a market where strong middle-class earnings stay ahead of real estate inflation, at least compared to high-cost coastal metros. Atlanta’s appeal lies in its dynamic economy fueled by tech, film, logistics, and corporate headquarters, which have raised household earnings and attracted new residents.
Yet affordability challenges persist, especially for singles and nonfamily households, whose incomes lag. The metro’s sprawling geography also produces divergent affordability pockets, with core urban neighborhoods more expensive than outer suburbs.
Atlanta’s example reveals how metropolitan economic diversification and wage growth can preserve middle-class access to homes amid national housing stress, but also spotlights the uneven landscape within metros that demands targeted local policies to ensure no group or neighborhood falls behind in housing opportunity.
4. Columbia, SC
Columbia’s position among the most affordable metros in 2025 serves as a testament to the ongoing relevance of smaller and mid-sized markets in the American housing fabric.
With average home prices around $227,000 and a relatively modest qualifying income near $66,000, Columbia’s median married-couple income of about $127,000 surpasses the needed threshold by over $60,000.
This cushion offers local families a genuine chance at homeownership without the financial strain seen in more expensive metros. Columbia’s affordability has roots in its moderate cost of living, stable economic sectors including education, government, and healthcare, and less overheated real estate markets.
While not encapsulating the high incomes of major metros, these factors combine to make Columbia an accessible housing market for the middle class. However, like many similar regions, Columbia must navigate pressures from population growth and potential price increases.
The city’s experience reflects a broader truth: affordability is not solely about income, but also about maintaining balanced demand and sustainable home price levels that allow families to plant roots and build economic futures.
5. Jackson, MS
Jackson embodies the kind of affordability increasingly rare in America’s largest metro areas. With average home prices at just $78,000 and a qualifying income around $58,000, Jackson’s median married-couple household income of approximately $108,000 swells the affordability gap by nearly $50,000.
This substantial margin means families in Jackson face fewer financial barriers to homeownership, enabling stability in a challenging national housing landscape. The city’s affordability is driven by lower living costs and a housing market that has remained relatively subdued in terms of price volatility.
Despite less economic diversification and lower overall incomes than larger metros, Jackson’s housing market offers a crucial haven for middle-class earners. However, sustaining affordability here depends on ongoing wage growth and economic development.
Jackson’s situation illuminates the other side of the coin to expensive metros: the possibility of homeownership rests as much on price containment as on income levels. For families seeking opportunity, Jackson presents a market where the American dream remains within reach, reinforcing that affordability is fundamentally a local equation.
6. Pittsburgh, PA
Pittsburgh's housing market in 2025 paints a hopeful yet complex picture for middle-class families. The metro’s median married-couple income of about $113,000 outpaces the qualifying income threshold of roughly $66,000 for its $245,000 average home price by over $46,000.
This suggests that despite economic headwinds, Pittsburgh remains relatively accessible to married couples seeking homeownership. The city’s ongoing transformation from a steel town to a hub for healthcare, education, and technology has boosted incomes and urban revitalization, supporting stable housing affordability.
However, Pittsburgh’s affordability is challenged by pockets of economic disparity and a modest but noticeable rise in home prices. The city’s experience underscores how evolving economic bases can underpin housing access, yet also highlights that income gains must keep pace with housing cost trends.
Pittsburgh’s balance offers an example of a legacy metro navigating housing pressures while maintaining middle-class pathways to homeownership, reflecting broader regional dynamics in the post-industrial American landscape.
7. Greensboro-High Point, NC
In Greensboro-High Point, affordability is defined by a significant income buffer relative to housing costs. Median married-couple household income of nearly $115,000 outstrips the qualifying income near $70,000 by approximately $45,000. This speaks to a housing market comfortable for families seeking to buy typical homes averaging around $263,000.
The metro benefits from a diverse economy spanning education, manufacturing, and services, which supports steady wage growth and moderate home price appreciation. Greensboro’s relatively affordable housing market compared to national benchmarks provides an attractive alternative to pricier urban centers.
However, as growth spreads from larger nearby metros, the area may face rising demand pressures. For now, Greensboro-High Point remains a stable homeownership opportunity for the middle class, illustrating how midsized metros contribute to national housing affordability by balancing economic vigor and price stability.
8. New Orleans-Metairie, LA
New Orleans-Metairie’s housing landscape shows a median married-couple income of about $121,000 comfortably exceeding the qualifying income requirement of roughly $78,000 by more than $42,000, with average home prices near $247,000.
This healthy gap allows many families to pursue homeownership without spending disproportionate income shares on mortgages. New Orleans’ vibrant culture, diversified economy, and ongoing urban renewal continue to influence housing demand and affordability.
Despite past natural disasters impacting housing supply, the metro’s market stability today reflects recovery and investment. That said, the city balances affordability with challenges like income inequality and pockets of economic distress.
New Orleans’ position among affordable metros highlights how cities with unique cultural and economic identities can maintain housing pathways for the middle class even amid broader national crises.
9. St. Louis, MO-IL
St. Louis offers one of the more pronounced affordability cushions among large metros. Its median married-couple household income, approximately $120,000, exceeds the qualifying income of about $78,000 by nearly $42,000, while average home prices rest near $188,000.
This combination underpins a market where homeownership remains within reach for many families. St. Louis is marked by moderate living costs, a diversified industrial and service economy, and sustained urban renewal efforts.
Like many older industrial metros, it must address economic disparities that influence localized housing challenges. Still, the broad affordability margin signals continued opportunity for middle-class households.
The city exemplifies how controlling housing costs and supporting wage growth can preserve homeownership access, crucial for economic stability and community vitality.
10. Oklahoma City, OK
Oklahoma City rounds out the top 10 with substantial affordability. Median married-couple incomes of about $111,000 outpace the qualifying income near $72,000 by approximately $39,000, with average home prices around $205,000.
The metro continues to benefit from a cost of living below national averages and a diversified economy including energy, aerospace, and healthcare sectors that bolster incomes. Oklahoma City’s housing market remains accessible for families, reflecting steady wage growth, moderate home appreciation, and ample supply relative to demand.
However, ongoing development pressures may influence future affordability. The city illustrates that even in growing urban areas, balanced economic and housing market conditions can maintain homeownership opportunities for the middle class, offering a model of affordability amid the national housing affordability crunch.
The top 10 least affordable metro areas in 2025
The following metros stand out not only for sky-high property values, but for the strong shortfall between median married-couple incomes and the qualifying income needed to secure a mortgage.
These regions reveal the new reality facing Americans striving for economic stability in a shifting housing market.
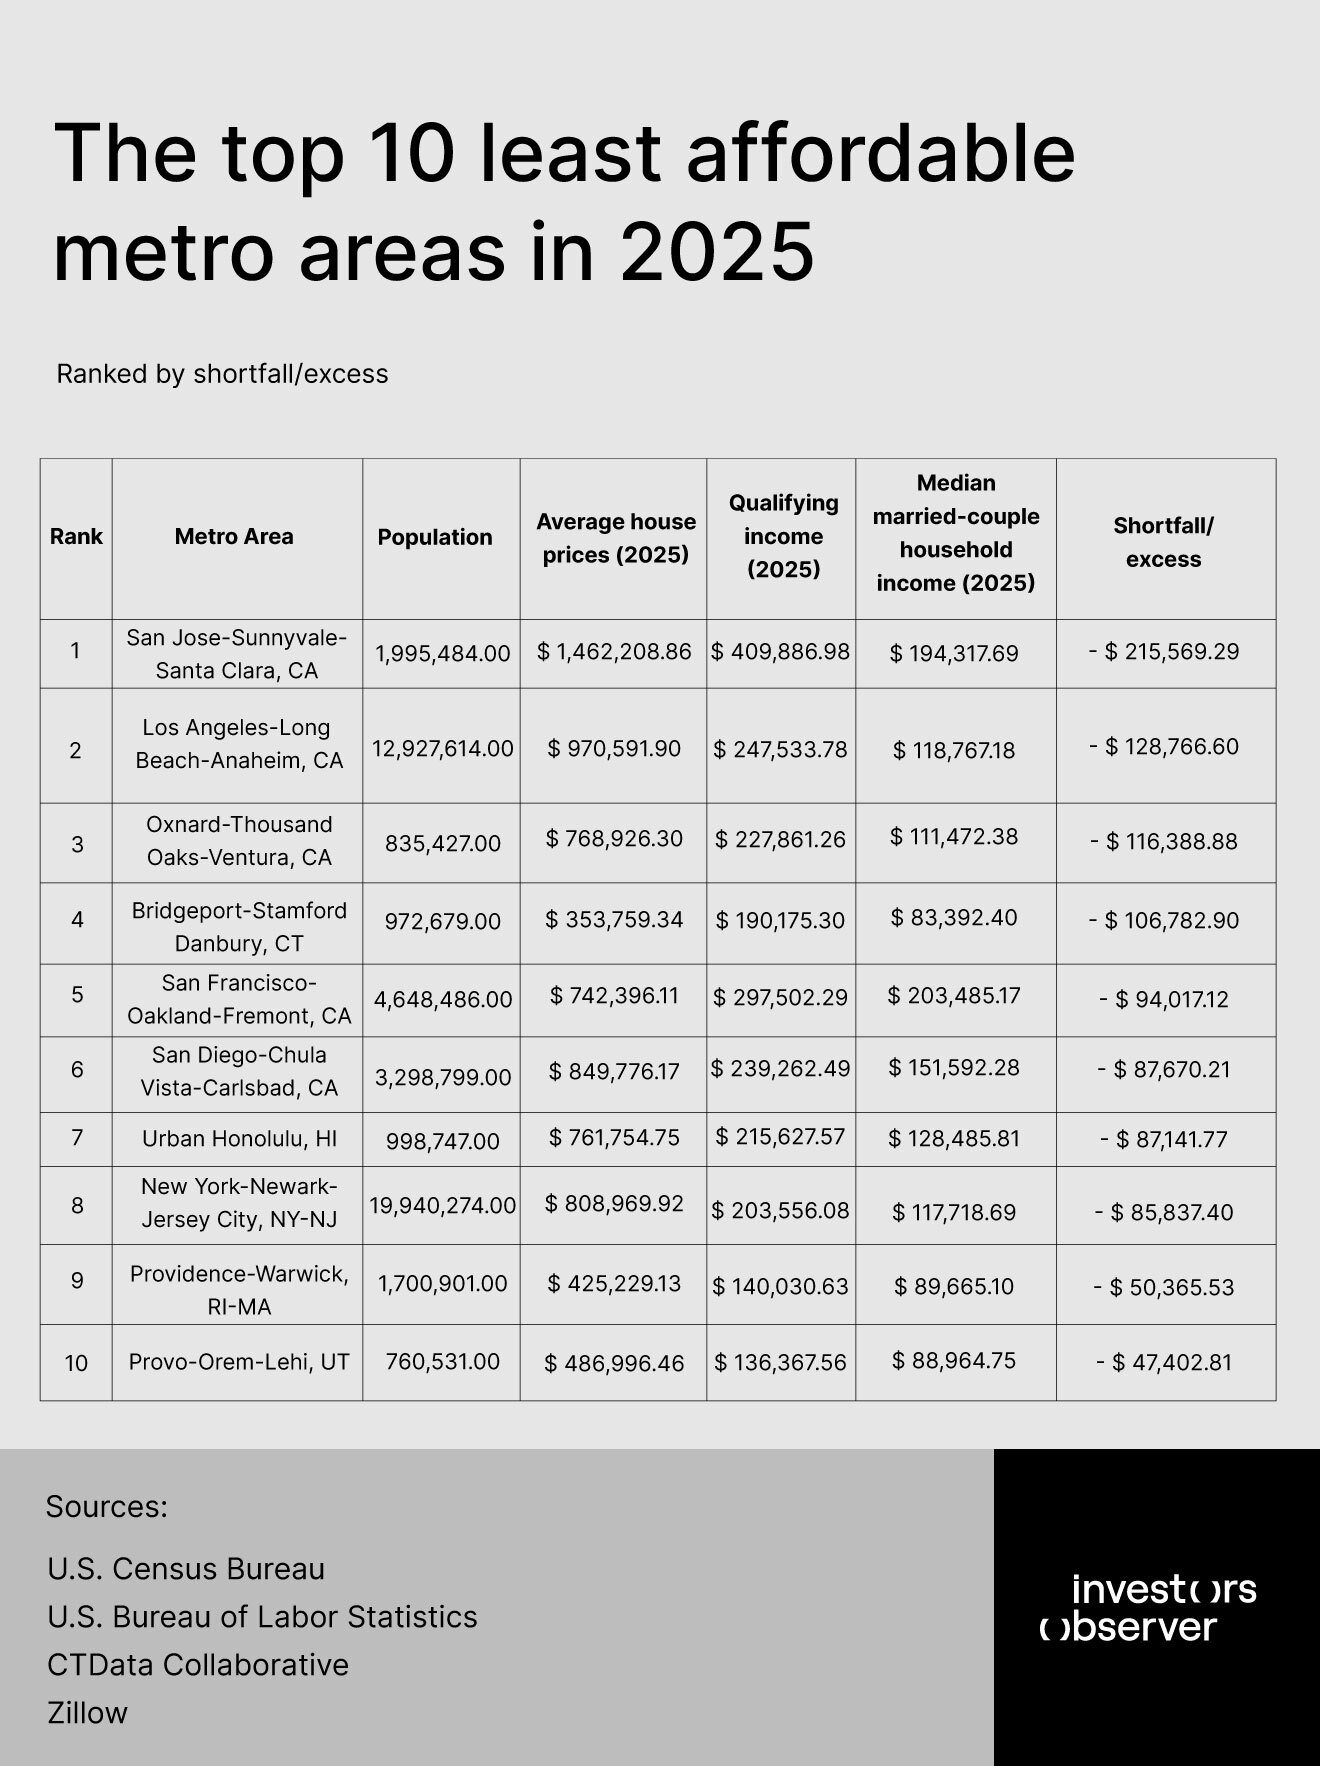
1. San Jose-Sunnyvale-Santa Clara, CA
San Jose tops the nation as the least affordable metro for married-couple homebuyers in 2025. The average home price sits at $1,462,209.
To qualify for a mortgage on such a property, households must meet an income threshold of $409,887 annually, calculated under the assumption that housing costs should not exceed 28% of gross income, considering a 6.5% interest, 20% down payment mortgage.
Yet, the median married-couple household income here is only $194,318, leaving a yawning shortfall of $215,569. This gap shows a strong divergence between income growth and housing price appreciation.
The income figure used is already adjusted upward by 1.4% in real terms from 2024 to 2025 based on the U.S. Bureau of Labor Statistics data, indicating that even real wage gains cannot keep pace with the skyrocketing price growth in this Bay Area tech hub.
The mismatch has become more acute compared to previous years when this shortfall was smaller. With a population nearing 2 million, the pressure from demand remains intense, driven by the tech economy's high-paid workers who inflate local property valuations.
This substantial income gap means many married-couple households – 64% of all households in the area – are financially unable to obtain mortgages under typical underwriting standards, pushing them either into rental markets or forcing relocation.
San Jose’s housing stress exemplifies a growing national trend where high-demand metros far outpace middle-class income growth, raising questions about sustainable urban economies and the social consequences of housing inaccessibility.
2. Los Angeles-Long Beach-Anaheim, CA
Los Angeles, the nation’s second-largest metropolitan area by population (over 12.9 million), faces profound affordability challenges in 2025. Home prices average $970,592, and qualifying incomes required to purchase homes reach $247,534.
Median married-couple incomes, however, are nearly half of that – $118,767 – resulting in a $128,767 income shortfall. This indicates a striking disconnect between wage levels and housing market entry costs, severely limiting the portion of the population that can realistically enter homeownership.
Los Angeles’ broad economic diversity masks pockets of severe strain – where income growth, though positive, has not kept pace with rapidly escalating housing prices typical of coastal California markets.
The mortgage assumptions, including a 6.5% interest rate and 20% down payment requirement, make the entry financial bar even more pronounced. The massive population drives sustained housing demand, but supply constraints and zoning regulations exacerbate the scarcity, fueling price inflation.
Even median incomes substantially above many other metros are insufficient here, illustrating the scale of the affordability crisis. This gap limits socio-economic mobility, as middle-class families are squeezed out of the market, impacting community stability and long-term wealth accumulation potential.
3. Oxnard-Thousand Oaks-Ventura, CA
In the Oxnard-Thousand Oaks-Ventura metro, housing costs and income gaps sharply reflect Southern California's broader affordability challenges. With a population around 835,000, this area shows an average home price of $768,926 while the qualifying income required is $227,861.
The median married-couple household income is $111,472, creating a $116,389 shortfall. This financial gap shows a situation where income covers less than half of what's needed for typical home purchase qualifications.
The mortgage-related costs and market prices reinforce this barrier. The region’s relatively smaller population compared to Los Angeles and San Jose does not shield it from steep housing costs, demonstrating how affordability issues permeate beyond large urban centers.
As in neighboring Southern California metros, income growth struggles against a sustained rise in property values. The widening gap undermines equitable access to housing for middle-class households and signals growing economic stratification.
The inability of local wages to meet qualifying incomes highlights not just market insufficiencies but also challenges in regional housing policies and economic planning.
4. Bridgeport-Stamford-Danbury, CT
Bridgeport-Stamford-Danbury presents a paradox within the top least affordable metros. The average home price here is notably lower – $353,759 – relative to California metros. However, the qualifying income is $190,175, nearly double the median married-couple household income of $83,392.
This creates a severe affordability shortfall of $106,783 despite more moderate housing costs. The disproportionate shortfall signals an earnings challenge rather than purely a housing price issue.
The 6.5% interest rate mortgage with a 20% down payment requirement raises the income bar substantially in relation to local wages. Bridgeport’s population of approximately 973,000 faces this imbalance with incomes that do not align well with mortgage qualification standards, reflecting either suppressed wage growth or labor market weaknesses.
The result is a metropolitan area where middle-income married-couple families struggle to achieve homeownership, despite average home prices that would conventionally be considered attainable.
This reveals an underlying mismatch between economic structure and housing finance requirements. Without income growth to match housing cost thresholds, the local market risks exacerbating social inequities and reducing access to stable wealth-building opportunities through home equity.
5. San Francisco-Oakland-Fremont, CA
San Francisco and its surrounding metro area, home to roughly 4.6 million people, continues to exemplify extreme housing affordability challenges in 2025. The average home price is $742,396, with a qualifying income requirement of $297,502.
The median married-couple household income, though relatively high at $203,485, falls short by $94,017. This indicates that despite having one of the highest median incomes nationally, households still face substantial barriers in meeting mortgage thresholds under typical lending standards.
The region’s elevated property values, propelled by robust tech-sector incomes at the top end, create upward pressure on overall housing costs. However, the median income metric reveals that many married-couple families sit below this tech-elite level, caught in a financial gap that complicates access to ownership.
The high qualifying income is a function of mortgage terms projected for 2025, including interest rates and down payment expectations, which set a demanding income floor. The persistent gap suggests structural challenges in bridging wage gains with housing affordability, curtailing middle-class entry into property ownership and altering demographic and economic dynamics in the metro.
6. San Diego-Chula Vista-Carlsbad, CA
The San Diego metro, comprising about 3.3 million residents, shows an average home price of $849,776, requiring a qualifying income of $239,262. The median married-couple household income is $151,592, creating an affordability shortfall of $87,670.
This means the typical earning household must overcome significant financial hurdles to meet lending qualifications for home purchases. San Diego mirrors other coastal California metros where inflation in property values increasingly outpaces local income growth, even as wages rise slightly in real terms – adjusted at 1.4% from 2024 to 2025.
The mortgage assumptions underscore how the combination of interest rates and down payment requirements elevate the qualifying income threshold, which median earners cannot meet.
Population size and demand pressures continue to intensify costs, contributing to shifting market accessibility. The data signal a tightening squeeze for middle-class families, limiting homeownership options and potentially fueling longer-term socioeconomic divides.
7. Urban Honolulu, HI
Honolulu stands out as a high-cost isolated market with 998,747 residents and an average home price of $761,755. The qualifying income needed for homeownership is $215,628, while the median married-couple income is $128,486, leaving an affordability gap of $87,142.
Honolulu’s insular geographic context contributes to elevated property values driven by limited housing supply and strong demand. Despite median incomes higher than many other metros, the steep qualifying income barrier reflects the cost impact of mortgage underwriting parameters and market fundamentals alike.
This gap shows how even relatively well-paid households in unique cultural and geographical environments still struggle to cross the homeownership threshold. Affordability constraints in Honolulu illustrate how housing market dynamics vary geographically but result in consistent disparity challenges for middle-class buyers.
8. New York-Newark-Jersey City, NY-NJ
New York, the largest metropolitan area with nearly 20 million residents, exhibits intense housing affordability strain. Average home prices hit $808,970, necessitating a qualifying income of $203,556.
Median married-couple earnings of $117,719 lag by $85,837, revealing a substantial income hurdle. The enormous population amplifies housing demand, while regulatory and supply factors also fuel price increases.
Despite higher nominal household incomes, the divergence between income and qualifying income signals structural challenges affecting a significant share of middle-class households.
Elevated mortgage costs further entrench barriers to market entry. This gap highlights risks of socioeconomic polarization and diminished pathways to wealth accumulation through homeownership.
9. Providence-Warwick, RI-MA
Providence’s affordability challenge carries a smaller price tag – $425,229 average home value – but a qualifying income of $140,031 against a median married-couple income of $89,665 produces a $50,366 shortfall.
This gap illustrates that even in less costly metros, median earnings do not sufficiently keep pace with lending requirements in 2025. The balance between income and housing costs strains housing access for a broad segment of the population.
The mortgage terms that link home prices to required income make affordability problems worse, even in mid-sized markets. The data reveal that affordability hurdles extend beyond large coastal hubs into small-to-mid-sized metro areas.
10. Provo-Orem-Lehi, UT
Provo’s metro area, with a population of 760,531 and average home prices of $486,996, shows a qualifying income of $136,368 but a median income of only $88,965.
The $47,403 shortfall indicates that even in interior western metros, housing affordability challenges exist as costs grow faster than incomes.
Mortgage standards similarly elevate the effective income needed to purchase a typical home, forcing prospective buyers to grapple with widening financial gaps.
This example shows how affordability pressures have become widespread, extending beyond historically expensive coastal markets to diverse geographic regions.
America’s housing divide continues to grow
The story told by the 2025 housing affordability data is not merely about numbers, but about shifting horizons for the American middle class – who for generations defined their progress by the keys to their first home.
Across a continent-sized country with immense regional variation, the findings point to a profound uncoupling between local incomes and the price of entry into stable, long-term homeownership.
What these figures make clear is the changing social contract, illustrated most starkly in high-cost metros like San Jose, Los Angeles, and San Francisco. In these hubs, the shortfall between what a typical married-couple household earns and what’s required to buy a median-priced home now stretches well into six figures – in San Jose, more than $215,000.
This gap is no longer limited to wealthy neighborhoods or just the biggest cities. It radiates outward to places like Ventura County in California and even Bridgeport, Connecticut, where local incomes simply cannot keep pace with home price inflation fueled by broader market pressures.
These metro areas become a kind of economic force, pushing middle-income families to the periphery – or out altogether. Not only do we see a retreat from the traditional model of wealth-building through home equity, but also a growing threshold of exclusion.
While strong local wages in tech and finance might elevate averages, median earners are being outpaced, changing the essential makeup of communities and intensifying inequality. Prospective buyers face not just steeper down payments and higher monthly costs, but also the emotional and psychological drag of living with economic uncertainty.
There are deeper implications here for society’s health. As opportunities for homeownership shrink, it becomes harder for families to put down roots, contribute to civic life, and envision a stable and prosperous future.
Mobility, once a virtue of the American system, begins to look more like displacement – cycling out essential workers, young families, and those without generational wealth. The old ladder of upward mobility is now missing rungs, and the risk is that cities will hollow out, losing diversity, innovative drive, and local character in the process.
Meanwhile, in metros like Providence or Provo, where prices and incomes are lower but still mismatched, the same dynamic plays out on a smaller scale. The crisis, in other words, is not only a coastal one – it is now embedded in the structure of the national market.
Methodology
Based on U.S. Census Bureau data collected at the end of 2024, 64% of households were family households, of which 74% were married-couple households.
Qualifying income
Qualifying income is the minimum annual income required to qualify for a mortgage on a typical home in a given metro area. This threshold is based on the rule of thumb that monthly housing costs – including mortgage payments, taxes, and insurance – should not exceed 28% of a household’s gross income.
Median married-couple household income
Median married-couple household income was calculated using the U.S. Census Bureau data for the end of 2023. Based on data from the U.S. Bureau of Labor Statistics, we adjusted this income by the real average hourly earnings increase from 2024 to 2025, which was 1.4%.
Mortgage variables
For 2025, we assumed a 30-year fixed-rate mortgage with a 6.5% interest rate and a 20% down payment.
Average home price
We used the Zillow Home Value Index (ZHVI), which measures the typical home value and market changes across each metropolitan area. ZHVI reflects typical home values within the 35th to 65th percentile range and is seasonally adjusted.
Metro selection
The study analyzed the 100 largest Metropolitan Statistical Areas (MSAs) by population. Because the Zillow Home Value Index (ZHVI) lacked home values for a few MSAs in the top 100, we replaced them with the next most populous metro areas in ascending order.
Limitations:
- The use of median married-couple household income excludes nonfamily and other household types, which often face higher barriers. This may understate affordability challenges faced by singles and nontraditional households.
- The mortgage assumptions – fixed 6.5% interest and 20% down payment – represent one scenario and actual borrowing terms can vary widely.
- Neighborhood-level data granularity is limited to metros, potentially masking intra-city neighborhoods with varying affordability profiles.
- Data are adjusted based on average wage growth, which may not capture uneven income gains across different demographic groups.
- This research excludes other housing costs such as property taxes, insurance, and maintenance, which also impact affordability.
Despite these limitations, the report provides a robust foundation for understanding middle-class housing affordability prospects across America’s largest metropolitan markets in 2025.
Sources:
- U.S. Census Bureau
- U.S. Bureau of Labor Statistics
- CTData Collaborative
- Zillow
Your email address will not be published. Required fields are markedmarked