S&P 500 keeps hitting record highs: what your Halloween money would be worth today if invested between 2015-2024

This year, InvestorsObserver’s researchers analyzed Halloween spending and S&P 500’s returns between 2015–2025 to answer the question: What if Americans skipped the spending and invested it in the S&P 500? The answer might scare them – in a good way.
Key findings
- If American households invested their Halloween budgets from 2015-2024 into the S&P 500, they would have turned the budget ($923.60) into $1,986.85 as of October 28, 2025 – gaining $1,063.25 and more than doubling their money (2.15x return).
- The 2015 investment of $74.34 is now worth $245.80 (230.6% ROI), while the 2024 investment of $103.63 is worth $124.88 (20.5% ROI). This difference shows that time in the market is everything – a single year of investment made a huge difference in returns.
- Halloween budgets rose from $74.34 in 2015 to $103.63 in 2024 (+39.4%), meaning families are spending more on costumes, candy, and decorations. Yet if they had invested just half that increase, they would have captured exponential growth instead.
- Even in the worst year to invest (2021 at $102.73 when S&P was at $4,605), investments gained $50.63 (49.3% ROI) in just 4 years. This shows that even bad timing in the S&P 500 produces profits.
- Small, consistent investing of roughly $92 per year (your average Halloween budget) generated over $1,000 in pure gains over a decade, showing the exponential power of compound growth even with modest amounts.
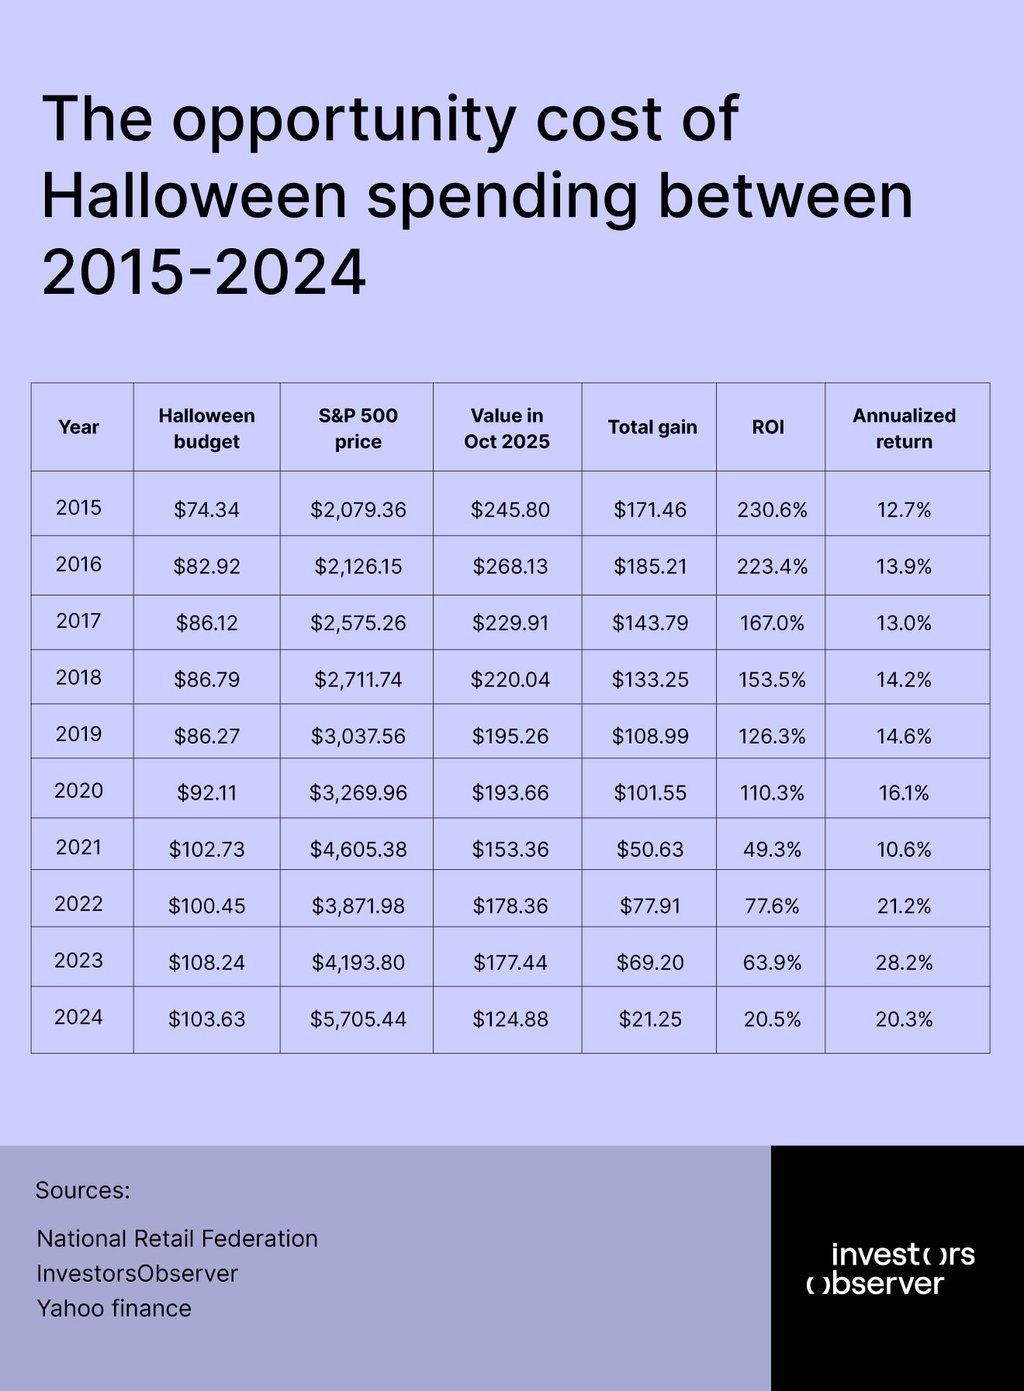
The opportunity cost of Halloween spending between 2015-2024
American families spent $923.60 on Halloween between 2015 and 2024 – money for costumes, candy, and decorations that disappeared after the holiday ended. However, the true cost of this spending goes far beyond the price tag.
By investing that same $923.60 in the S&P 500 instead, families would now have $1,986.84 as of October 28, 2025, representing an opportunity cost of $1,063.24 in foregone wealth.
This means every dollar spent on Halloween carried a hidden price: the exponential growth that dollar could have generated over time. For the average family spending roughly $92 annually on Halloween, this translates to missing out on approximately $106 in potential investment gains per year – money that could have built emergency funds, funded children's education, or contributed to retirement accounts.
The opportunity cost shows that small annual choices create the difference between struggling and thriving financially. When viewed through this lens, Halloween's true cost isn't what families pay at checkout – it's what they never accumulated.
Year-by-year performance: time is money
The 2015 Halloween investment of $74.34, made when the S&P 500 sat at $2,079.36, could have grown to $245.80 as of October 28, 2025 – a 230.6% return over nearly a decade. In sharp contrast, the 2024 investment of $103.63, made when the S&P 500 was at $5,705.44, could have grown to just $124.88, representing only a 20.5% return in less than a year.
The difference is not a matter of luck or market timing – it's purely a function of time. The 2015 investment has had nearly nine extra years to compound and grow, creating a 210.1 percentage point advantage in total return. This confirms an old truth: the earlier the investment, the greater the return.
This analysis captures the full investment cycle across a decade of market volatility. The earliest investments (2015-2017) would have averaged a 207% total return, while even the worst performing entry point – 2021, when the S&P 500 reached $4,605 – still could have generated a 49.3% return in just four years.
The 2022 investment, made during a market correction, could have produced a 77.6% return in barely three years. This reveals a key insight: even "bad" market timing in the S&P 500 produces profits over time. The market correction that scared many investors in 2022 has proven to be a buying opportunity, with that year's investment now significantly outperforming the 2021 entry point.
The most interesting part appears when we look at annualized returns. While early investments show lower annualized returns (2015 at 12.7%), this is actually a sign of maturity – a 10-year compounding period naturally shows lower annual percentages than recent investments.
The 2023 investment, held for barely two years, shows a 28.2% annualized return, while the 2024 investment is 20.3% annualized. These higher annualized returns reflect the vigorous market performance of recent years, but they don't change the fundamental lesson:
someone who invested in 2015 has accumulated $245.80, while someone investing in 2024 has only $124.88 – a difference of $121.08, or 97%, solely due to the extra nine years of compounding. This is the true value of time in investing: it transforms modest investments into meaningful wealth.
Comparing to the S&P 500 benchmark
The Halloween investment strategy, while unconventional, could have achieved an average annualized return of 15.9% across investments made from 2015 to 2023. This outperformed the S&P 500's 10-year average return of 11.3% by 4.6 percentage points. The higher returns resulted from the dollar-cost averaging effect of investing the same modest amount annually, regardless of market conditions.
The S&P 500 experienced significant volatility during this period, including a 31.49% gain in 2019 and an 18.11% loss in 2022. Despite this volatility, consistent annual investments created a portfolio that captured the market's overall upward trajectory while mitigating the impact of poor timing.
2025 Halloween spending: what one year of investing could bring
American households are projected to spend a record $114 per person on Halloween in 2025, or $13.1 billion nationally. But here's what that same $114 could become if invested in the S&P 500 for just one year: approximately $126.88 by October 2026, assuming the market delivers its historical 11.3% average annual return.
That's a gain of $12.88, essentially a free $13 from simply choosing to invest instead of spend. If the market performs stronger, as it has in recent years, that $114 could grow to $131 or even $137, generating $17-$23 in pure profit with no effort beyond buying and holding. Over a decade, as this analysis has shown, that single $114 investment could grow to $275 or more.
The record-high spending trend reveals an important choice facing American families: whether to maximize immediate Halloween enjoyment or redirect even a portion of that growing budget toward future financial security. For every $114 spent on 2025 Halloween celebrations, families are forgoing more than $12 in potential gains within just twelve months – a cost that compounds a lot over years and decades.
Methodology and sources
This analysis examines the investment returns generated from hypothetically investing annual American Halloween spending into the S&P 500 index from 2015 through 2025. The research combines two primary data sources: consumer spending data and historical market performance.
Data sources
- Halloween spending figures for 2015-2024 were obtained from the National Retail Federation (NRF)
- S&P 500 closing prices were sourced from Yahoo Finance historical data, with prices captured on the last trading day of October each year (near Halloween) to establish consistent investment dates
- The 2025 projection reflects NRF forecasts announced in September 2025
Investment calculation
For each year, we calculated the number of S&P 500 shares that could have been purchased using the full annual Halloween budget at that year's closing price. The calculation follows this formula: Shares = Halloween Budget ÷ S&P 500 Price.
We assumed fractional share purchases with no transaction fees, reflecting modern brokerage capabilities. All investments are held through October 28, 2025, allowing us to calculate current portfolio values based on that date's closing price of $6,875.16.
Return metrics
We calculated three return measurements for each year's investment: (1) Total Return on Investment (ROI), expressed as a percentage of the original investment; (2) Total Dollar Gain, the absolute profit generated; and (3) Annualized Return, calculated using the compound annual growth rate (CAGR) formula to show yearly performance independent of holding period. This allows comparison between 10-year investments and 1-year investments on an equivalent annual basis.
Key assumptions
This analysis assumes a buy-and-hold strategy with no rebalancing, dividend reinvestment at market prices, and no consideration of taxes or fees. It reflects performance of the broad market index without attempting to time market peaks or valleys. The analysis uses actual historical prices and does not project future performance beyond 2025 projections. Portfolio values reflect nominal returns without adjustment for inflation or purchasing power changes.
Limitations
This hypothetical analysis does not account for transaction costs, tax implications, or opportunity costs of alternative investments. It assumes investors would have the discipline to invest annually regardless of market conditions, which may not reflect real-world investor behavior during significant market downturns. The 2025 figure is a projection based on NRF forecasts and may differ from actual consumer spending when final data is released.