Research: Women lose $1 million in retirement wealth due to gender wage gap

The gender pay gap remains one of the most persistent issues in the modern workforce. While it is widely acknowledged, its impact on long-term wealth accumulation is less frequently discussed.
The latest research conducted by the Investors Observer researchers has revealed that American women accumulate at least $1 million less than men over a typical 40-year career, assuming average retirement contributions are invested in an S&P 500 Index fund.
Key findings
- Over a typical 40-year career, the average male worker in the U.S. accumulates $2.73 million in portfolio wealth, assuming average retirement contributions are invested in an S&P 500 Index fund.
- By comparison, an average female worker investing her savings under the same conditions accumulates $1.75 million in portfolio wealth, resulting in a $1 million gap.
- This compounding effect means that even small annual differences in contributions lead to vastly different wealth outcomes by retirement.
- While the wage gap between men and women has narrowed, by 2023 women earned 83% of what men earned on average.
- The wage gap and resulting investment gap persist despite women’s increasing presence in higher-paying industries.
The compounding effect of lower retirement contributions
Because retirement savings are typically based on a percentage of income, the gender pay gap translates directly into an investment gap.
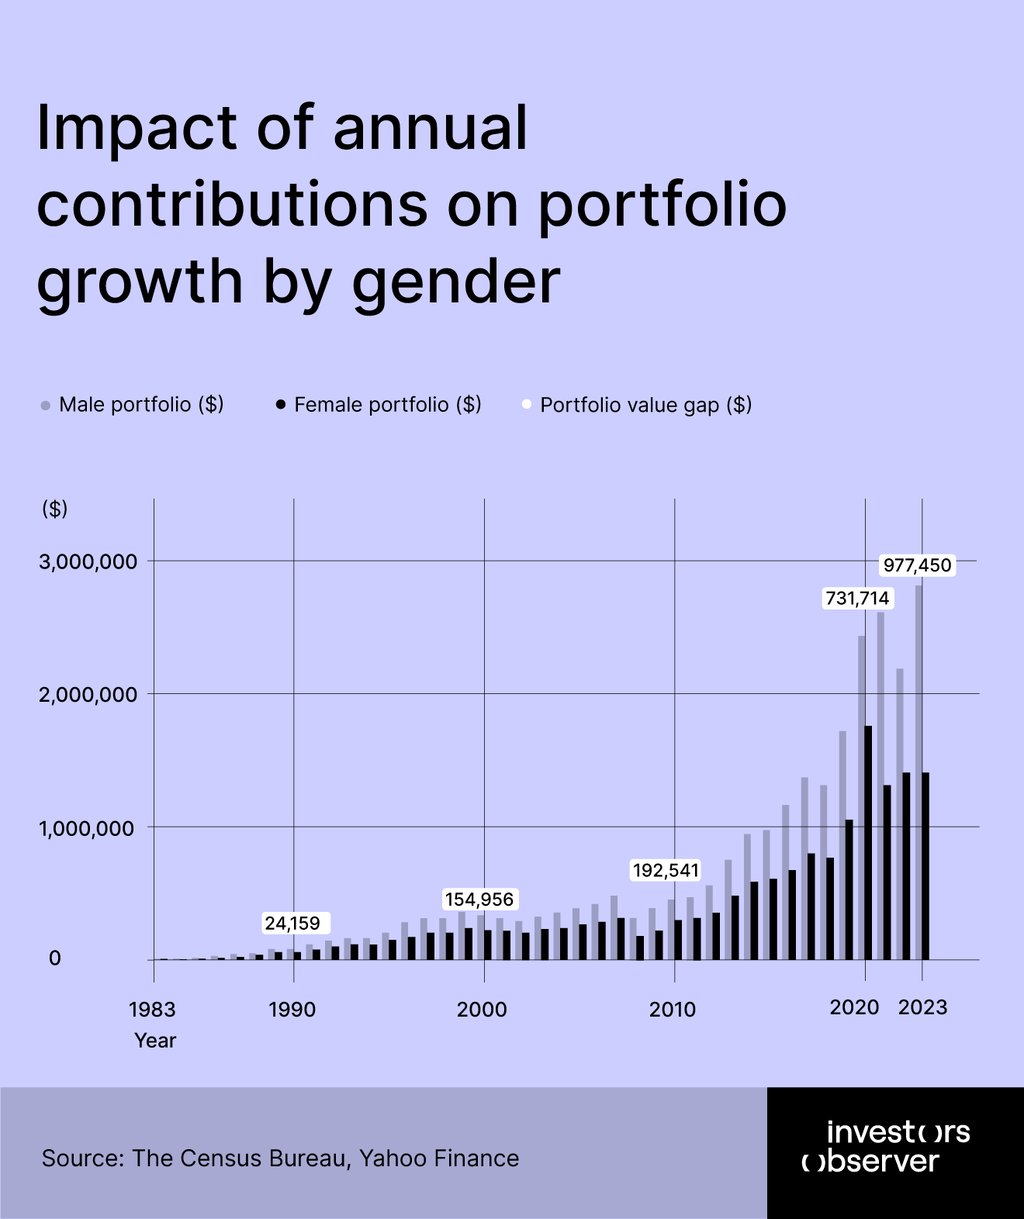
By the end of 1989, the male portfolio had grown to $60,375.31, while the female portfolio reached $36,717.93. Women’s portfolios were 60.8% of men’s total. Despite equal annualized returns, men’s higher earnings and contributions led to greater accumulation, widening the gap.
By the end of 1999, the male portfolio had reached $453,680.29, while the female portfolio was $284,472.04 – 62.7% of the male portfolio. Women made steady gains, but men’s larger contributions compounded over time, preventing the gap from closing.
This decade saw significant market downturns, including the dot-com crash and the 2008 financial crisis. By the end of 2009, the male portfolio was $456,181.97, while the female portfolio was $290,030.36, meaning women’s portfolios were 63.6% of men’s. The gap remained stable, though the absolute wealth difference grew.
A strong bull market fueled portfolio growth. By the end of 2019, men’s portfolios reached $1,719,714.32, while women’s grew to $1,102,749.77, putting women at 64.1% of men’s total. While both groups saw historic market gains, men’s advantage in contributions continued to reinforce the gap.
By the end of 2023, the male portfolio had grown to $2,733,794.35, while the female portfolio reached $1,756,344.64 – a 64.2% share of the male portfolio. Despite strong market performance in early years, the gender gap persisted, with men maintaining significantly higher accumulated wealth.
How the pay gap persists over time
Between 1983 and 2023, the gender pay gap gradually narrowed, with women’s earnings rising from 63.6% of men’s earnings to 82.7%. While this represents substantial progress, the gap remains persistent, and its effects compound over time.
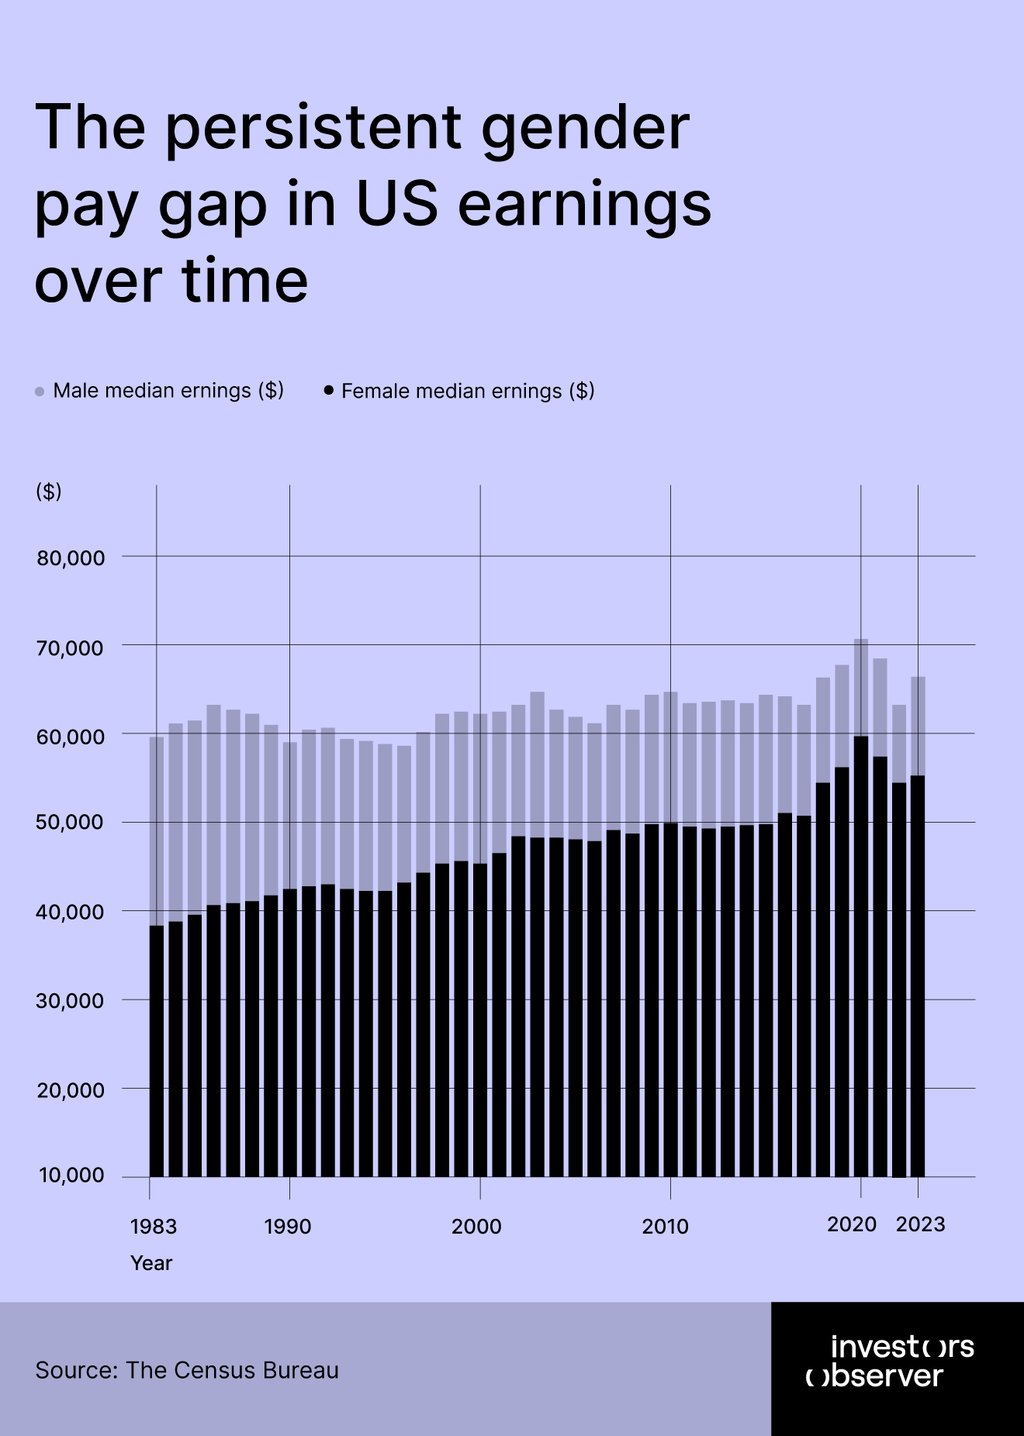
In 1983, median annual earnings (adjusted to 2023 dollars) were $59,930 for men and $38,120 for women, meaning women earned just 63.6 cents for every dollar men earned.
This percentage fluctuated slightly but remained below 70% throughout the decade. By 1989, women’s earnings had reached $41,950, or 68.7% of men’s earnings ($61,090).
The 1990s saw slow but steady gains. By 1999, the median male worker earned $62,780, while the median female worker earned $45,400, meaning women’s earnings had risen to 72.3% of men’s earnings.
The early 2000s showed minimal progress, with the pay gap hovering around 74% to 76%. In 2009, men’s earnings were $64,700, while women’s were $49,810, translating to 77% of men’s earnings.
Growth in women’s earnings relative to men’s continued, reaching 83% in 2019. However, even at its peak, the gap persisted.
By 2023, women’s median earnings were $55,240, compared to $66,790 for men – meaning women earned 82.7% of what men earned.
While these numbers show steady progress, they also highlight that a full four decades of workforce evolution have not closed the gap. U.S. women are still earning significantly less than men, and in some years, progress has stalled or even reversed.
The wage gap and economic shocks
The data also suggests that during economic downturns, the gender pay gap can widen or stagnate.
During the 2008 financial crisis, men’s median earnings fell to $63,400, while women’s earnings dropped to $48,880, keeping the gender earnings ratio at 77.1% – showing that women’s earnings growth did not accelerate despite overall market downturns.
During the COVID-19 recession in 2020, men’s median earnings rose to $71,780, while women’s earnings reached $59,670, bringing the ratio to 83.1%.
Conclusion: A persistent disparity with long-term consequences
The gender pay gap has undoubtedly improved since the 1980s, but even in 2023, American women earned an average of $11,550 less per year than American men.
This disparity translates into lower retirement contributions, weaker investment growth, and ultimately, a $1 million shortfall in lifetime wealth accumulation.
Unless the wage gap is fully closed – and measures are taken to support equal investment opportunities – women will continue to face a financial disadvantage that extends far beyond their working years.
Methodology: How we calculated the gender wealth gap
To understand the long-term financial impact of the gender pay gap, the researchers analyzed 40 years of earnings and retirement contributions data (1983–2023) for full-time workers in the U.S.
The goal was to measure how differences in earnings between men and women translate into disparities in retirement wealth over a typical working lifetime (ages 25–64).
Earnings data
The research used real median annual earnings data (adjusted to 2023 dollars) from the U.S. Census Bureau. These figures reflect full-time workers' income over the 40-year period and were adjusted for inflation using standard economic indices.
Retirement savings and investment assumptions
Since people tend to save a percentage of their income, the research factored in average retirement contributions based on data from Bank of America’s Financial Life Benefits Impact Report (2023):
- Men contribute 6.6% of their annual earnings to retirement accounts.
- Women contribute 6.2% of their annual earnings to retirement accounts.
Due to the lack of historical savings rate data, these percentages were applied consistently across the entire 40-year period.
How we calculated investment growth
To estimate how these contributions would grow over time, the study assumed that both men and women invested their annual retirement savings in an S&P 500 Index fund at the start of each year. The portfolio growth was then modeled based on historical annualized returns of the S&P 500 from 1983 to 2023.
What this research doesn’t capture
This analysis provides an illustrative model rather than a precise prediction. This research does not account for career interruptions due to caregiving responsibilities, which tend to disproportionately affect women.
Additionally, longitudinal income progression was not modeled, meaning the study assumes average earnings throughout a worker’s career rather than tracking wage increases over time.
Nonetheless, the findings highlight a clear pattern: lower lifetime earnings lead to lower investment potential, reinforcing long-term wealth inequality.
Sources
- United States Census Bureau. Table A-7. Number and Real Median of Total Workers and Full-Time, Year-Round Workers With Earnings by Sex and Female-to-Make Earnings Ratio: 1960 to 2023
- United States Census Bureau.
- Yahoo Finance. S&P 500 Index annualized returns (1983 to 2023)
- Bank of America. 2023 Financial Life Benefits Impact Report