
Investors searching for real opportunities in the 2025 U.S. housing market need to look beyond headlines to where inventory truly lingers.
This analysis ranks states by how long listings remain unsold, drawing on hard numbers like median days on market (ranging from 24 to 105) and the percentage of listings still available after 30 days (from 55% up to 78%).
These insights pinpoint markets offering the greatest negotiation leverage, price flexibility, and value-add potential for buyers ready to act where others hesitate.
Key findings
- Montana, Hawaii, and Louisiana are the stalest states. Montana leads with a median days on market (DOM) of 105 and 76% of listings unsold after 30 days, while the national average is 66.53%. Hawaii follows with a DOM of 93 and 77% unsold, while Louisiana has a DOM of 75 and the highest unsold rate at 78%.
- Top 10 stalest states far exceed national averages. The top 10 states all have median DOMs between 61 and 105 days (national median: 55 days) and unsold rates after 30 days from 68% to 78%. This highlights markedly slower sales and more stagnant inventory in these markets.
- High price drops signal seller motivation. Several stalest states show elevated price drops, such as Florida (34.5%), Texas (30.3%), and Louisiana (27.8%), compared to the national landscape. This suggests sellers in these markets are increasingly willing to reduce prices to attract buyers.
- While the national average of listings unsold after 60 days is 45.36%, in the stalest states, more than half of listings remain unsold after 60 days – Louisiana (59.2%), Hawaii (57.4%), and Florida (58.3%) – indicating chronic sluggishness and potential for deeper discounts.
- The top 10 least stale states have the fastest-moving housing markets in the country. In these states, homes typically sell in just 24 to 44 days, much quicker than the national median of 55 days. 55% to 66% of listings remain unsold after 30 days, showing quite strong demand and fewer properties sitting on the market compared to other states.
Top 10 states with the most stale listings
We ranked each state using a staleness score that combines two key numbers: how long homes typically stay on the market and what percentage remain unsold after 30 days. More weight is given to how long listings sit. Higher scores mean homes are taking longer to sell and more are still available – a clear signal of a slower market.
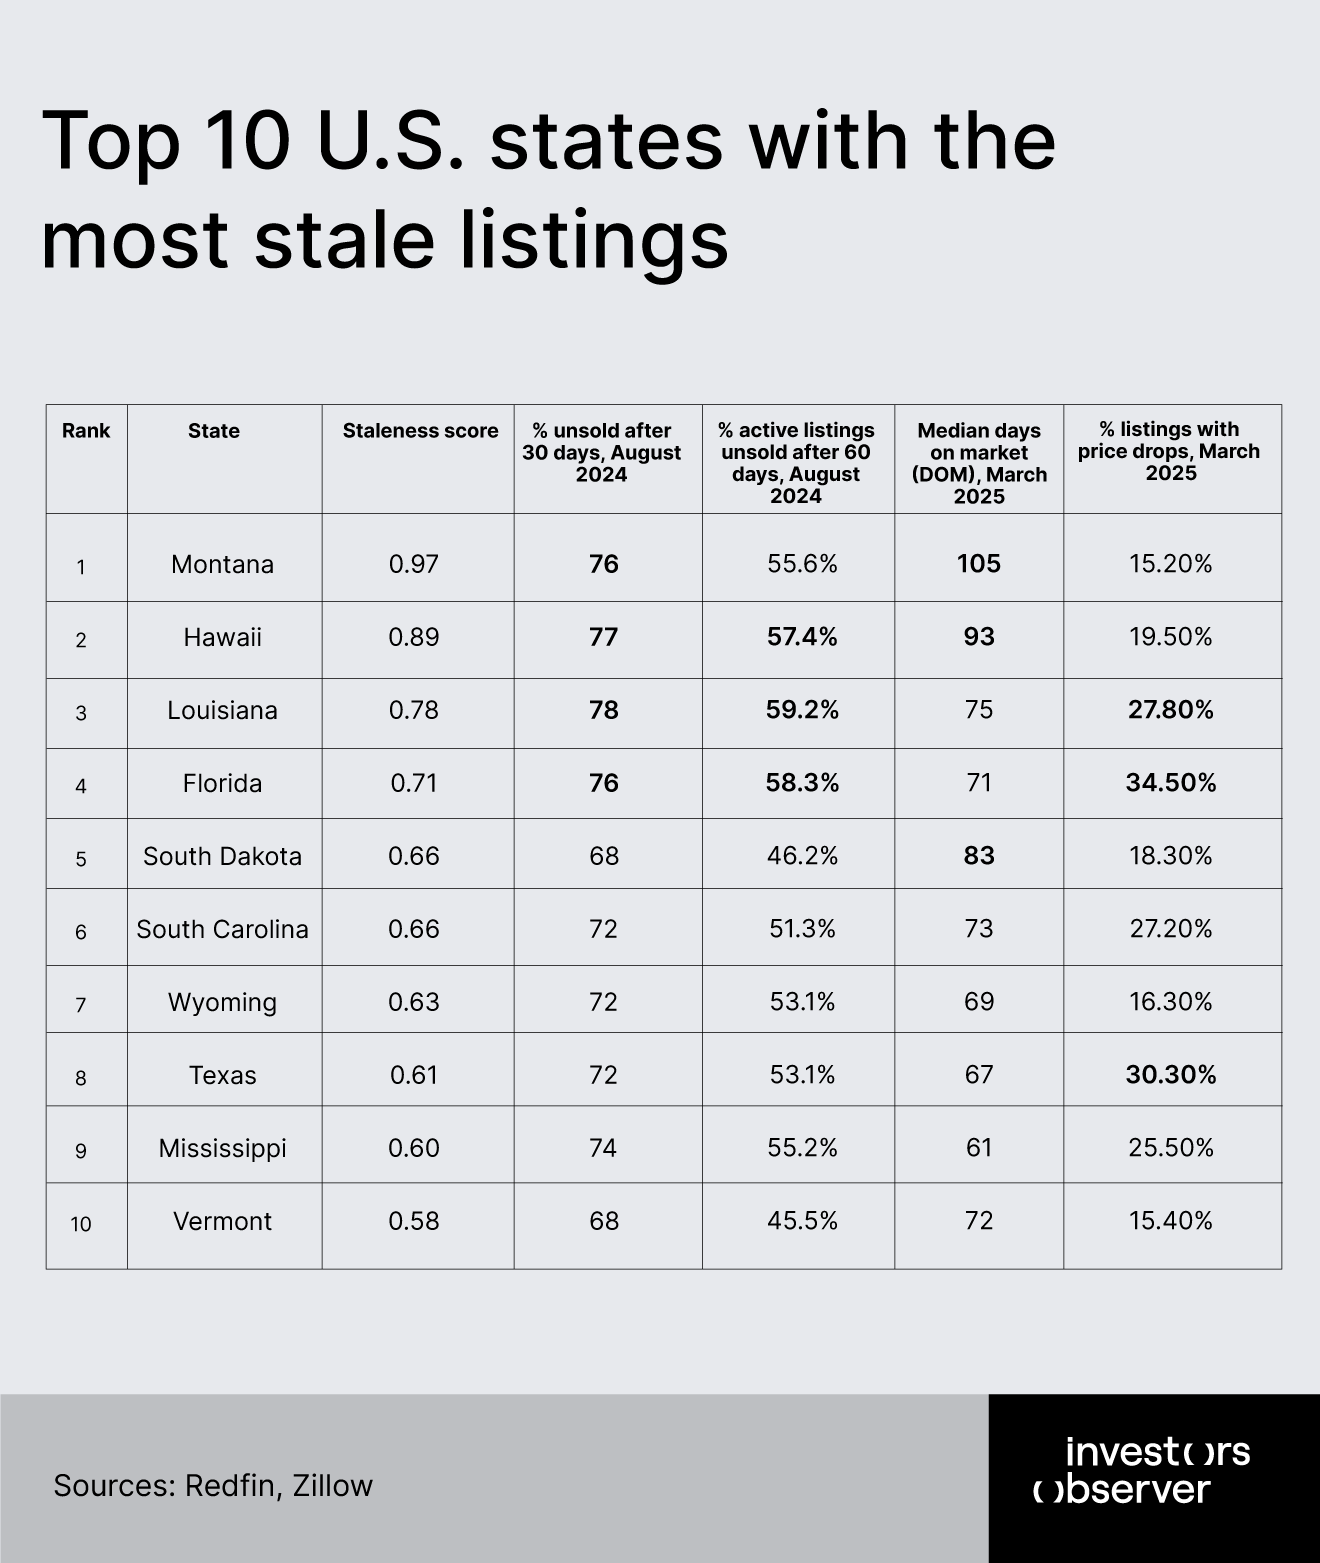
Montana tops the list of listing staleness, with a DOM of 105 – far above the national average of 55 days. In August 2024, 76% of listings remained unsold after 30 days and 55.6% after 60 days. Despite these slow sales, only 15.2% of listings saw price drops, suggesting sellers are reluctant to reduce prices.
Hawaii’s housing market is sluggish, with a median DOM of 93 and 77% of listings unsold after 30 days. After 60 days, 57.4% remain unsold. Price drops affect 19.5% of listings. High home prices (often above $1 million) and a high cost of living limit buyer activity, resulting in prolonged selling times and significant unsold inventory.
Louisiana has a median DOM of 75 and the highest unsold rate after 30 days at 78%, with 59.2% still unsold after 60 days. Price drops are seen in 27.8% of listings. Rising insurance costs and 7.25% mortgage rates contribute to slow sales, with homes typically listed longer than the national average.
Florida’s market shows a median DOM of 71, with 76% of listings unsold after 30 days and 58.3% after 60 days. Price drops are frequent, affecting 34.5% of listings. Pandemic-era construction oversupply, slowed in-migration, and natural disaster risks contribute to high staleness and frequent seller concessions.
South Dakota’s median DOM is 83, with 68% of listings unsold after 30 days and 46.2% after 60 days. Price drops occur in 18.3% of listings. The state’s smaller market size and moderate buyer demand lead to slow absorption of inventory, despite fewer price adjustments compared to other top states.
South Carolina records a median DOM of 73. In August 2024, 72% of listings were unsold after 30 days, and 51.3% after 60 days. Price drops affected 27.2% of listings. The market reflects a cooling trend, with affordability constraints and post-pandemic demand shifts slowing sales and prompting more frequent price reductions.
Wyoming’s median DOM is 69, with 72% of listings unsold after 30 days and 53.1% after 60 days. Price drops are seen in 16.3% of listings. Limited population growth and a slower sales pace contribute to a high proportion of stale inventory, though sellers are less likely to reduce prices than in other states.
Texas has a median DOM of 67, with 72% of listings unsold after 30 days and 53.1% after 60 days. Price drops are common, affecting 30.3% of listings. Oversupply in metro areas and affordability pressures have led to increased listing staleness, prompting more sellers to adjust prices to attract buyers.
Mississippi’s median DOM is 61, with 74% of listings unsold after 30 days and 55.2% after 60 days. Price drops affect 25.5% of listings. Economic challenges, including a median household income of $35,000 and a 20% poverty rate, limit buyer demand and keep homes on the market longer.
Vermont rounds out the top ten with a median DOM of 72. In August 2024, 68% of listings were unsold after 30 days and 45.5% after 60 days. Only 15.4% of listings saw price drops. The state’s slow-moving market is characterized by limited inventory turnover and seasonal sales patterns.
Top 10 states with the least stale listings
To rank the least stale listings, we again used a staleness score that combines two key numbers: how long homes typically stay on the market and what percentage remain unsold after 30 days, giving more weight to days on market. For the least stale states, those with the lowest scores have homes that sell quickly and fewer listings sitting unsold – clear signs of a fast-moving market.
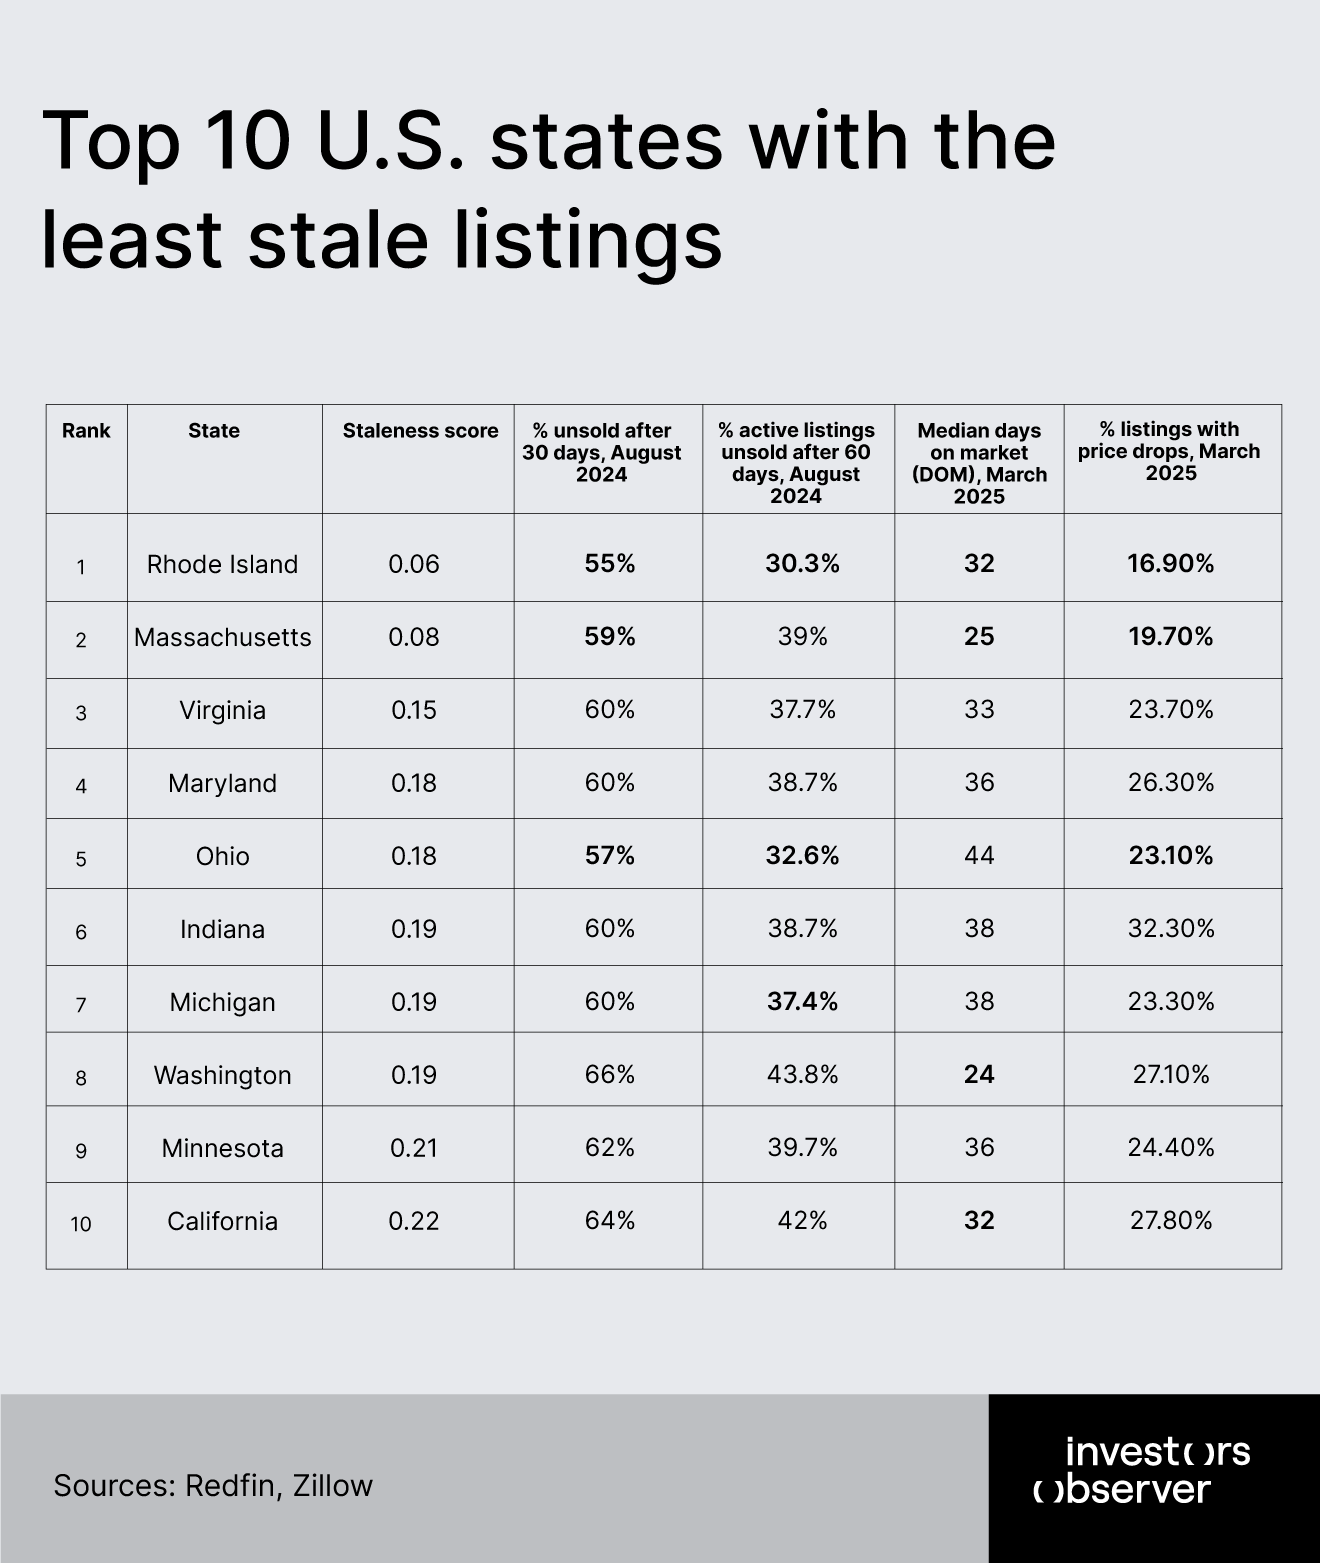
The least stale states in the US housing market, led by Rhode Island, Massachusetts, and Virginia, combine relatively low percentages of unsold listings after 30 days with notably short median days on market. Rhode Island stands out with only 55% of listings unsold after 30 days and a median DOM of 32, reflecting strong demand and limited supply, partly due to land constraints and significant inbound migration from states like New York.
Massachusetts also demonstrates a fast-moving market, with just 59% of listings unsold after 30 days and almost the nation’s shortest median DOM at 25 days. This rapid turnover is driven by persistent housing shortages, restrictive zoning, and steady demand from students and professionals attracted to top institutions like MIT and Harvard. Virginia and Maryland follow closely, both with 60% unsold after 30 days and median DOMs of 33 and 36 days, respectively, indicating healthy competition among buyers and robust market activity.
Other states in the top 10, such as Ohio, Indiana, Michigan, and Washington, benefit from affordability and strong local economies. For example, Ohio’s cities like Toledo have become housing hotspots, with homes selling in just over a month due to prices well below the national median and an influx of remote workers. Even large, competitive markets like California and Washington make the list, showing that strong demand can drive quick sales even in populous states.
Overall, these least stale states are characterized by a combination of affordability, economic opportunity, and demographic trends that keep inventory moving swiftly. For investors, such markets may offer less room for negotiation but promise faster turnover and lower holding costs compared to slower, more stagnant markets.
Implications for investors
The data reveal that states with the stalest listings – such as Montana, Hawaii, and Louisiana – offer significant negotiation leverage for investors. In these markets, sellers face prolonged listing times and high unsold inventory, which is reflected in elevated rates of price drops. This environment allows investors to pursue properties at prices below initial asking, as sellers become more motivated to close deals.
Extended days on market and high unsold rates also suggest that many properties may be in need of updates, are overpriced, or are located in less competitive areas. In Montana, for instance, only 15.2% of listings had price drops despite the longest DOM in the nation, indicating for investors to improve or reposition properties in markets where sellers have not yet responded to slower sales. In these states, long listing times but relatively few price drops suggest that some owners are holding out, creating room for buyers to add value or negotiate better terms.
Furthermore, the persistence of high unsold inventory after 60 days – such as Louisiana (59.2%), Hawaii (57.4%), and Florida (58.3%) – signals a sustained buyer’s market. Investors who monitor these trends can time their market entry to coincide with periods of increased price reductions or distressed sales, maximizing their potential for favorable acquisitions.
Overall, the data suggests that slow-moving markets with high staleness scores provide both leverage and opportunity for investors willing to negotiate, invest in improvements, or hold for market recovery. On the other hand, the least stale states, with rapid turnover and lower unsold rates, may offer fewer discounts but reduced holding risk and faster returns.
Methodology
Data for the percentage of active listings unsold after 30 days (August 2024) and the percentage of active listings unsold after 60 days (August 2024) were taken from the Redfin database. These figures represent the share of listings that remained unsold after 30 and 60 days, respectively, as of August 2024.
Calculations for the national average of active listings unsold after 30 days in the US (2024) and the national average of active listings unsold after 60 days in the US (2024) were done by taking all the collected state-level data from Redfin and deriving the median.
The data for median days on market (DOM) for March 2025 were collected from Redfin and Zillow. Since some states lacked data for April 2025, March was used as the reference period. Each value represents a rolling 90-day period. For example, “March 2025” covers listings from January 1 to March 31, 2025, across all state neighborhoods and zip codes.
The percentages of active listings with price drops for the 90-day period ending March 2025 were taken from Redfin. These figures are calculated for each state, neighborhood, and zip code over a rolling 90-day window. For example, “March 2025” covers listings from January 1 to March 31, 2025.
To rank states by listing staleness, we calculated a composite staleness score for each state using two primary metrics from the dataset:
- Median Days on Market (DOM), March 2025: Indicates the typical number of days a home remains listed before selling. Higher values mean slower-moving inventory.
- Percentage of Active Listings Unsold After 30 Days, August 2024: Measures what portion of listings remain unsold after 30 days, directly reflecting market sluggishness.
Calculation process:
- Normalization: both metrics were normalized to a 0-1 scale across all states, ensuring comparability regardless of their original units or ranges.
- Weighting: we assigned a 60% weight to normalized median DOM and a 40% weight to normalized percentage of listings unsold after 30 days. This gives greater influence to how long homes typically sit on the market, in line with industry convention and the dataset’s emphasis.
- Composite score: for each state, the composite staleness score was calculated as: Staleness Score=0.6×(Normalized Median DOM)+0.4×(Normalized % Unsold After 30 Days)
- For the top states with the most stale listings, states were ranked in descending order by their staleness score – higher scores indicate slower markets with more unsold inventory and longer listing times. For the least stale states, the ranking was done in ascending order – lower staleness scores reflect markets where homes sell quickly and fewer listings remain unsold after 30 days. This approach highlights both the slowest and fastest-moving housing markets based on the same composite metric.
Limitations
This analysis uses state-level averages, which do not capture variations within cities or neighborhoods.
Sources
- Redfin (sales speed, stale listings, data center)
- Zillow (median DOM)
- List With Clever (market duration research)
- ConsumerAffairs (state home sale durations)
- LiveNowFox (map of stale inventory)
- ResiClub Analytics (domestic migration trends)
- CRE Daily (migration shifts)
Your email address will not be published. Required fields are markedmarked