Research: Top 10 U.S. states with highest and lowest retirement portfolio losses since election

Retirement portfolios across the U.S. have taken a beating in the wake of the 2024 election, with Trump’s return to the White House and a fresh wave of tariffs rattling markets.
In this report, InvestorsObserver’s research team breaks down how much the average retirement portfolio has declined since the election state by state, as well as who's taken the biggest hit.
States with the largest nest eggs, such as Connecticut and New Jersey, saw the biggest losses in retirement portfolios. Meanwhile, states with more modest savings — including Utah and North Dakota — held up far better.
But no state, and no strategy, came out unscathed after the “Liberation Day” tariff shock.
Key findings
- Connecticut retirees bore the brunt of the trade war fallout, with average losses of $22,339 in 100% equity portfolios since the election.
- Utah retirees — who have more modest retirement portfolios — lost the least, with an average decline of $12,900 over the same period.
- The average all-stock retirement portfolio is down $17,860 since Trump’s win.
- The average 60/40 retirement portfolio is up slightly, gaining $188 since the election.
- 9 of the 10 worst-hit states are blue states, while 9 of the 10 least-affected are red.
- The “Liberation Day” tariff shock erased $57,199 from the average 100% equity retirement portfolio. Even conservative 60/40 portfolios lost an average of $35,962 during the crash.
- More aggressive investors — typically younger Americans — took the biggest hit, due to larger stock exposure in their retirement portfolios.
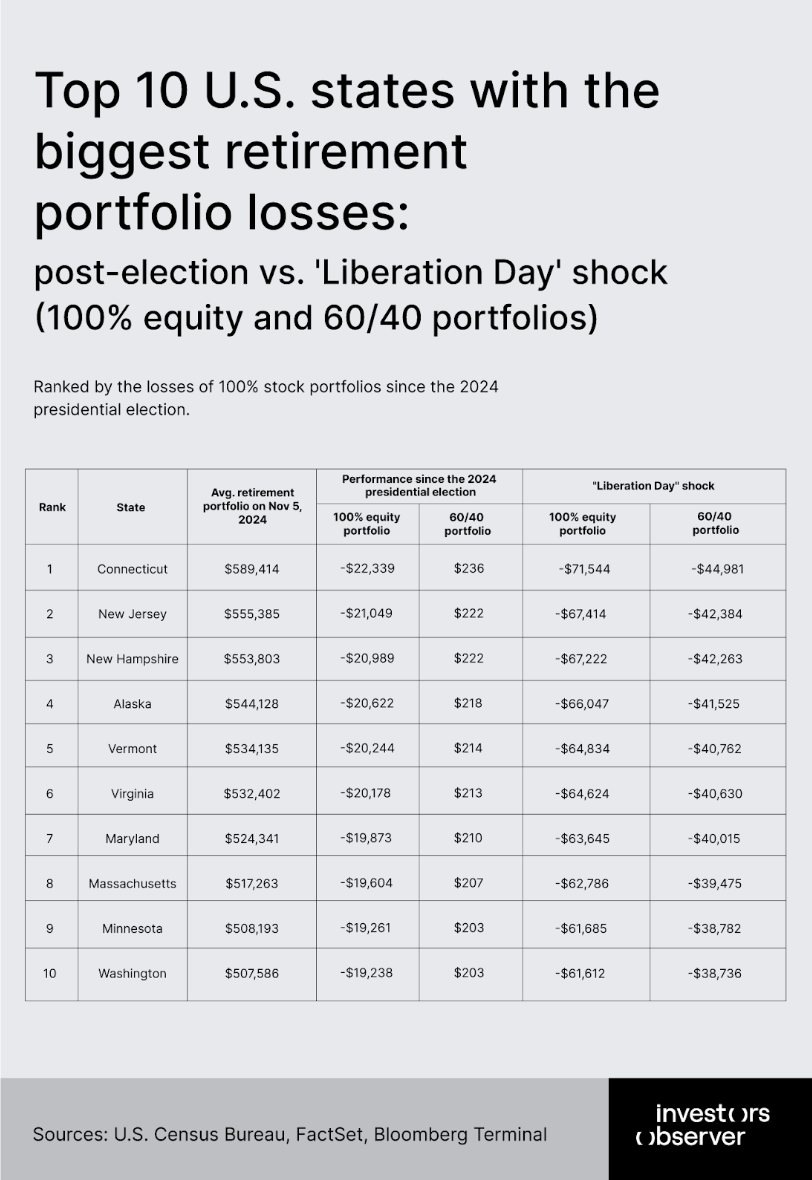
Top 10 U.S. states with the highest retirement losses
Based on the performance of a 100% equity portfolio (as benchmarked to the S&P 500), the top 10 states with the highest portfolio losses are:
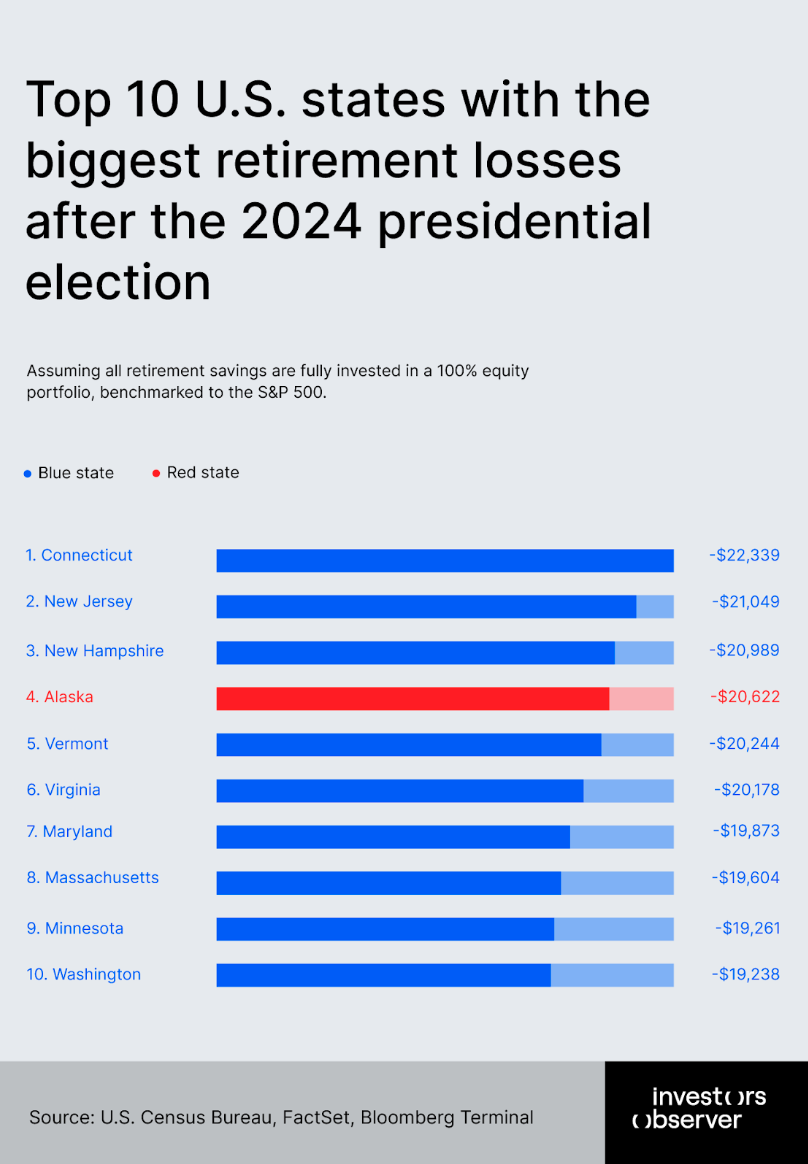
Retirees in Connecticut saw the biggest declines. The average 100%-stock portfolio dropped $22,339 (-3.79%). By contrast, those using a more conservative 60/40 mix (60% stocks, 40% bonds) gained $236 over the same period. After the “Liberation Day” shock, 100% equity portfolios fell as much as $71,544, while 60/40 portfolios lost $44,981.
New Jersey retirees, with average portfolios of $555,385, lost $21,049 (-3.79%) in all-stock accounts, while 60/40 investors saw gains of $222. After the “Liberation Day” crash, 100% equity accounts bottomed out at a loss of $67,414, versus –$42,384 for 60/40.
In New Hampshire, $553,803 average portfolios dropped $20,989 (-3.79%) assuming 100% of retirement savings are invested in stocks. The same portfolios using a 60/40 split gained $222. At the peak of the tariff fallout, 100%-equity accounts lost $67,222, while 60/40 investors saw $42,263 in losses.
Alaska retirees lost $20,622 (-3.79%) on $544,128 all-stock portfolios, while 60/40 investors gained $218. The “Liberation Day” shock delivered a loss of $66,047 in all-stock portfolios, compared to $41,525 losses for 60/40 portfolios.
Vermont’s $534,135 average portfolios fell $20,244 (-3.79%) in all-stock portfolios. 60/40 investors finished slightly ahead, with gains of $214. The “Liberation Day” crash led to a loss of $64,834, while the average 60/40 portfolio fell $40,762.
Virginia retirees, with the average portfolio of $532,402, lost $20,178 (-3.79%) under a 100%-equity allocation. But 60/40 investors gained $213. In the aftermath of “Liberation Day,” all-stock portfolios dropped $64,624, while 60/40 portfolios declined $40,630.
Maryland’s average retirement portfolio of $524,341 dropped $19,873 (-3.79%) in all-stock accounts, while 60/40 investors gained $210. After “Liberation Day,” all-stock portfolio losses peaked at $63,645 versus $40,015 for 60/40.
Massachusetts portfolios, averaging $517,263, lost $19,604 (-3.79%) in all-stock portfolios, while 60/40 investors gained $207. After “Liberation Day,” stock portfolios bottomed out at a loss of $62,786 versus a loss of $39,475 for 60/40 portfolios.
Minnesota retirees, with the average retirement portfolio of $508,193, absorbed $19,261 (-3.79%) in losses from 100% equity exposure, while 60/40 allocations gained an average of $203. After the “Liberation Day” crash, all-equity portfolios fell $61,685, compared to $38,782 losses for 60/40.
Washington’s average $507,586 retirement portfolios dropped $19,238 (-3.79%) in all-stock accounts. Investors with a 60/40 allocation gained $203. After “Liberation Day,” the worst drawdown in all-equity portfolios was $61,612, while 60/40 portfolios fell $38,736.
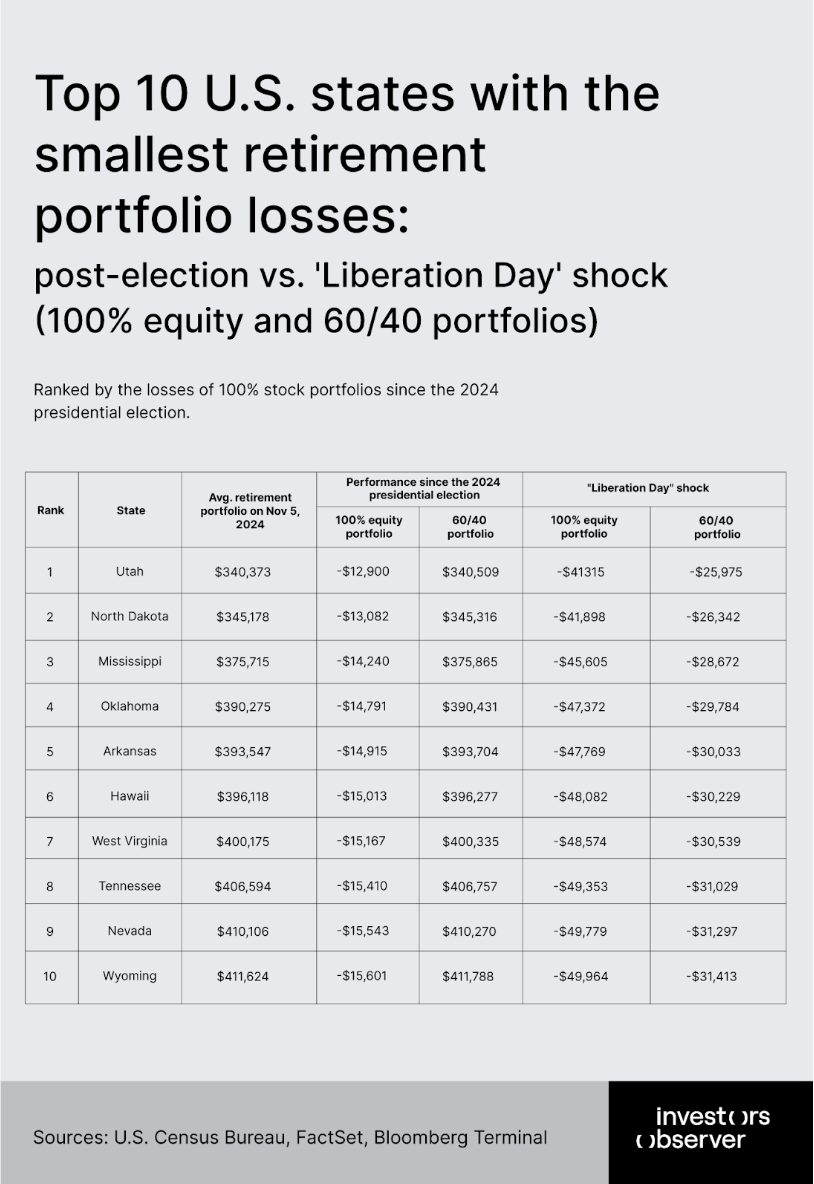
Top 10 states with the smallest retirement portfolio losses
Based on the performance of a 100% equity portfolio (as benchmarked to the S&P 500), the top 10 states with the smallest retirement portfolio losses are:
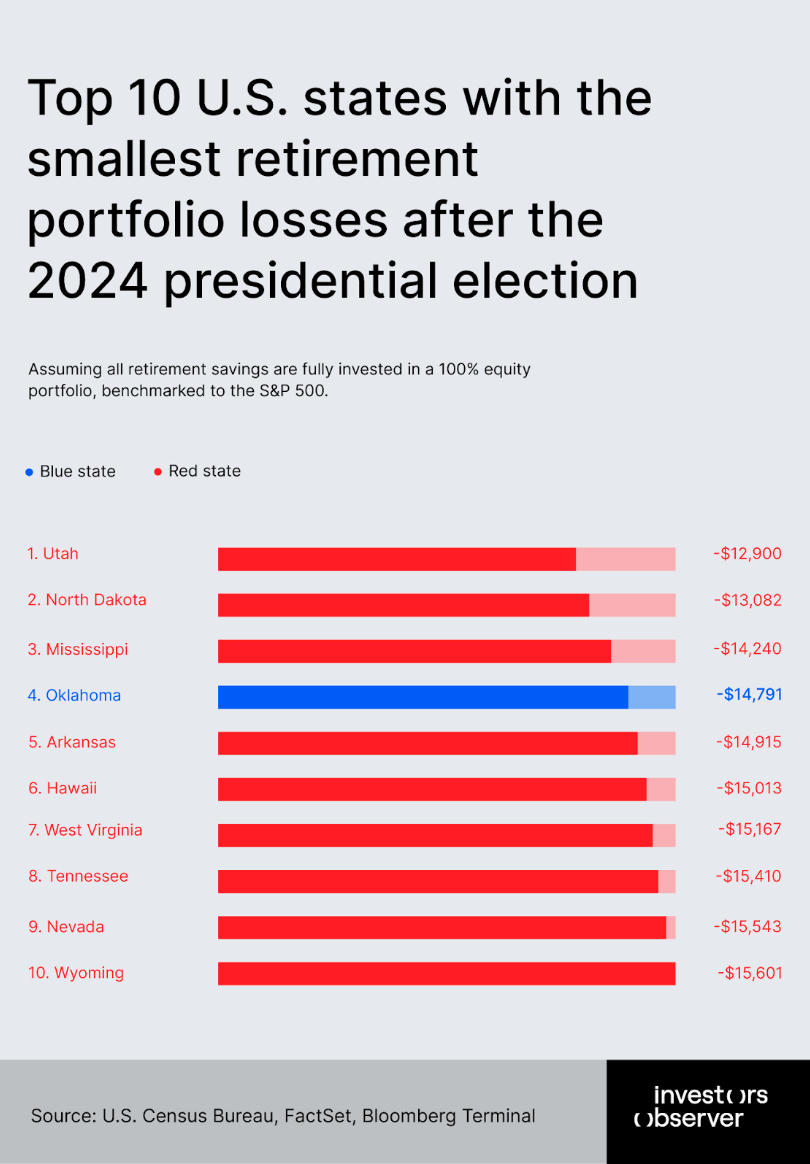
The ten least-affected states after the 2024 election — led by Utah, North Dakota, Mississippi, Oklahoma, and Arkansas — showed notable resilience in retirement portfolios.
In these states, the average 100% stock portfolio lost between $12,900 and $14,900, well below the national average of $17,860. Utah retirees saw the smallest dollar losses, with 100% equity portfolios dropping $12,900, while Arkansas retirees lost $14,900.
This relative outperformance is largely due to smaller average retirement balances.
For example, Mississippi’s average retirement portfolio was $375,715 in November 2024, compared to $589,414 in Connecticut, resulting in far lower dollar losses despite identical percentage declines.
Retirees using a 60/40 portfolio (60% stocks, 40% bonds) fared even better.
In all ten states, average 60/40 portfolios posted small but positive returns, ranging from $136 in Utah to $157 in Arkansas, even as stock-only portfolios shed thousands of dollars over the same period.
This highlights the defensive value of bonds during equity drawdowns.
During the “Liberation Day” crash on April 2, 2025, 100% equity portfolios in Utah dropped $41,315 at their lowest point, while 60/40 portfolios lost just $25,975, a difference of more than $15,000 in favor of the more diversified strategy.
That same pattern held across all ten states, reinforcing the value of diversification.
Retirees with 60/40 allocations avoided the steepest losses triggered by tariff shocks and policy uncertainty and came out ahead during one of the most volatile stretches for markets in recent memory.
Implications
The contrasting experiences of states with the highest and lowest 100% equity retirement portfolio losses following the 2024 presidential election highlight the profound impact of portfolio composition on retirement security.
States with the largest average portfolios, such as Connecticut and New Jersey, suffered the most severe dollar losses, exposing retirees to significant short-term volatility and the risk of sequence-of-returns shocks.
While a diversified 60/40 allocation in these states offered some protection – delivering modest positive returns over the period and cushioning losses during extreme events like the "Liberation Day" tariff shock – this approach could not fully insulate retirees from the market’s turbulence.
Notably, during the tariff-induced downturn, equity-only portfolios suffered drawdowns up to 37% deeper than their 60/40 counterparts, highlighting the critical role of diversification in reducing risk. However, even the more conservative 60/40 strategy, with nearly half of assets allocated to bonds, was not immune to the disruptive effects of tariffs and policy changes, as both balanced and all-equity portfolios endured significant declines.
This highlights the exceptional severity of the political and economic shocks during this period and the limitations of traditional diversification in shielding retirement savings from major systemic events.
On the other hand, states with the least retirement losses, including Utah, North Dakota, and Mississippi, benefited from smaller average portfolio sizes, greater adoption of conservative investment strategies, and in some cases, more resilient local economies.
In these states, the 60/40 portfolio not only protected against major losses but even delivered small positive returns, demonstrating its effectiveness as a long-term risk management tool. The “Liberation Day” shock was also less severe for these states, as the absolute dollar declines were smaller and the diversified portfolios absorbed much of the volatility.
These findings align with long-term evidence that 60/40 portfolios in the U.S. have historically produced more consistent returns and lower maximum drawdowns than equity-only strategies, particularly during periods of heightened uncertainty or political transition.
The implications for policymakers, advisors, and retirees are clear. The data reinforces the importance of diversification – especially for pre-retirees and retirees who are most exposed to market timing risk and have less time to recover from large losses.
Finally, the political and economic uncertainty surrounding national elections can have a pronounced psychological and financial impact on retirement savers, suggesting a need for greater education and policy support to encourage prudent, long-term portfolio construction that can weather both market cycles and political shocks
Limitations of this research
Our analysis relies on average retirement savings by state and assumes everyone invests in either a 60/40 portfolio or 100% equities, which may not reflect real-life choices or individual circumstances.
Using benchmarks like the S&P 500 and a standard 60/40 simplifies complex, diverse investment behaviors and ignores factors such as withdrawals, spending needs, or personal risk tolerance. As a result, the actual impact on retirees may differ from the averages shown here.
Methodology
Average retirement portfolio as of November 5
To estimate the average retirement portfolio value as of November 5, 2024 (Election Day), we began with the most recent available data on average retirement savings by state, published by the U.S. Census Bureau in April 2024. We then extrapolated this figure forward to November 5 by assuming portfolio growth in line with the median return of a classic 60/40 portfolio and the S&P 500 Index over this period. For details on the benchmark used to represent the 60/40 portfolio, see the section titled "60/40 portfolio benchmark."
Average retirement portfolio as of April 28 (60/40 allocation)
To estimate the value of the average retirement portfolio as of April 28, 2025, under a 60/40 asset allocation, we assumed that the average portfolio calculated as of November 5 was fully invested in a traditional 60/40 portfolio. The return applied to this period was based on the performance of the benchmark identified in the "60/40 portfolio benchmark" section.
Average retirement portfolio as of April 28 (100% equities)
To assess the performance of a fully equity-invested retirement portfolio, we assumed the November 5 value was invested entirely in stocks. The S&P 500 Index — a widely used proxy for U.S. equity market performance – was used as the benchmark to represent the 100% stock allocation.
“Liberation Day” shock (60/40 portfolio)
The “Liberation Day” shock for the 60/40 portfolio was calculated by comparing the average 60/40 portfolio value on April 1, 2025, with the lowest value reached following the “Liberation Day” tariff announcement. For the 60/40 benchmark, see the "60/40 portfolio benchmark" section.
“Liberation Day” shock (100% equities)
The same method was applied to the 100% equity portfolio: we compared the average S&P 500 portfolio on April 1 with the lowest point following the tariff announcement.
60/40 portfolio benchmark
To represent the traditional 60/40 allocation, we used the iShares Core Growth Allocation ETF (AOR). This ETF seeks to track the investment results of an index composed of underlying equity and fixed income ETFs and is designed to reflect a standard 60% equity, 40% fixed income portfolio aligned with a conservative growth strategy.
Blue and red state classification
States were classified as "blue" or "red" based on the outcome of the 2024 presidential election in the U.S. A state was considered blue or red if a candidate secured either an outright majority or a plurality of the popular vote.
Data sources
- U.S. Census Bureau
- FactSet
- Bloomberg Terminal