Research: The tax breaks that backfired – how Trump’s megabill hurt the poorest Americans

President Donald Trump’s “big, beautiful bill” was sold as tax relief for everyone. But this filing season, our state‑by‑state analysis shows something very different: in eight states, the poorest families actually pay more in taxes, not less, while the richest households get tax cuts worth tens of thousands of dollars.
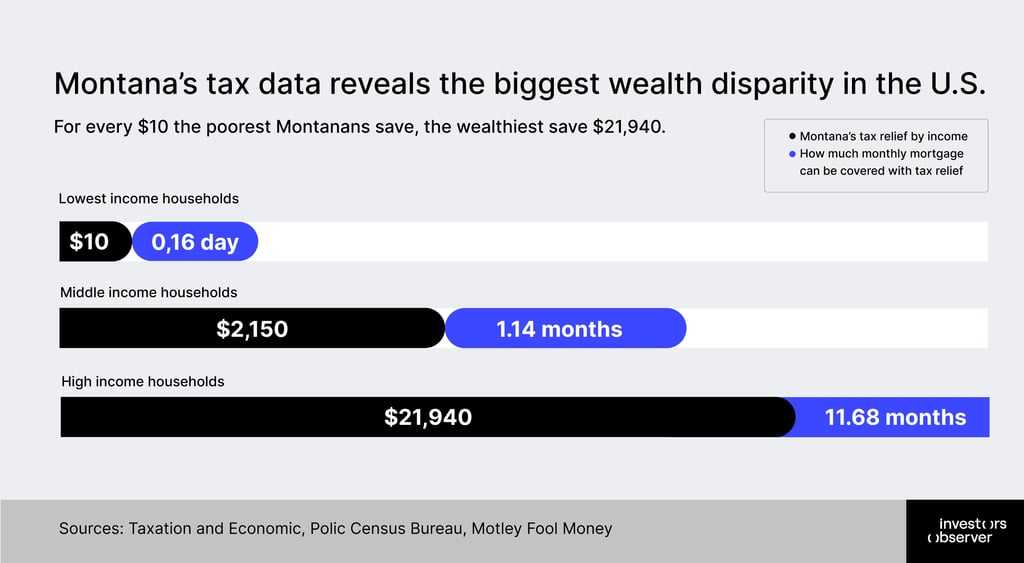
In Montana alone, the wealthiest residents receive tax breaks 2,194 times larger than the relief going to the poorest, enough to cover almost a year of mortgage payments at the top, while low‑income families get about enough for two gallons of milk.
This report shows who really comes out ahead under the new law and why so many working families are left with little or nothing to celebrate.
Key findings
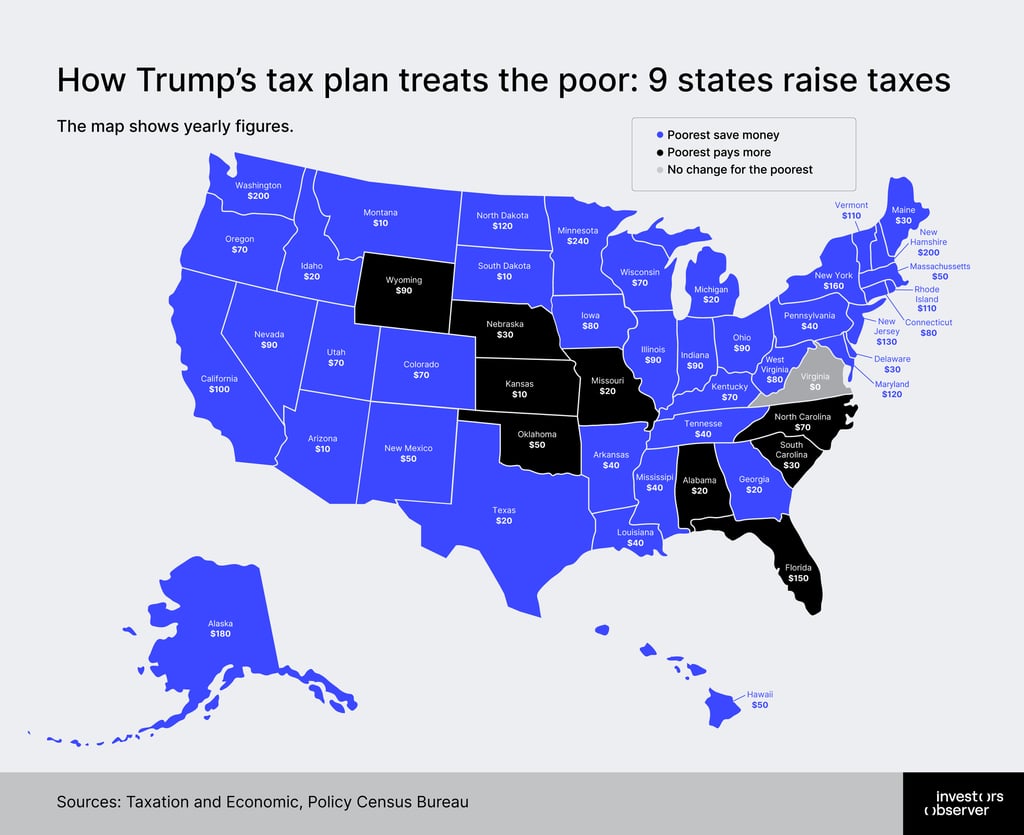
- In 9 states, the poorest Americans will actually pay more taxes.
- The near-wealthy save over 2,000 times more than the poor.
- Middle income tax savings won’t cover one month’s mortgage in 8 states.
- Where you live matters as much as the paycheck: West Virginia’s middle class gets 2 months of mortgage covered by the tax breaks, while California’s gets 3 weeks.
- In high‑cost states like New Jersey, California and New York, the wealthiest households get tax cuts of around $20,000 while low‑income families get at most a few hundred dollars.
$150 poorer: the 8 states where Tax Relief raises taxes on the poor
Florida hits its poorest residents hardest, with the biggest tax increase. Families in the poorest 20% will pay an extra $150 a year in taxes – money they can’t afford to lose. At the same time, the state’s wealthiest households pocket $20,160 in savings every year.
In Wyoming, the poorest families face a $90 tax increase. In North Carolina, it’s $70 more. In Oklahoma, $50. South Carolina and Nebraska each add $30. Alabama hits low‑income families with $20 extra, and Kansas rounds out the list at $10.
“This is a reversal of the basic promise of tax relief: help those who need it most. The economic implications extend beyond individual bank accounts. When wealthy households receive $20,000 tax breaks, much of that money gets saved or invested, not spent in local economies,” explained Sam Bourgi, senior analyst at InvestorsObserver. “When working families get $100, or lose $150, they’re forced to cut back on essentials. Less money for groceries means less revenue for local stores. Less mortgage coverage means more families at risk of foreclosure.”
The pattern is this across all eight states: while the poor pay more, the wealthy save thousands. In Wyoming, the near-wealthy save $19,980 – over 222 times what the poorest pay in increases.
Florida’s gap is even bigger: while the poorest households struggle with a $150 hit, the wealthiest save $20,160.
The 2,194-times wealth gap: the rich win big
For every $10 the poorest Montanans save, the wealthiest save $21,940. Montana’s tax data reveals the biggest wealth disparity in the U.S. – the wealthiest residents receive tax breaks 2,194 times larger than what the poorest get.
While struggling families pocket a mere $10 (barely enough for a fast-food meal) the state’s top earners walk away with savings that could cover six months of mortgage payments.
Montana isn’t alone. Across America, the tax bill creates a significant gap between the rich and poor.
South Dakota’s wealthy save $17,140 a year while the poorest save just $10. Arizona’s richest households get $15,470 in tax breaks, compared with $10 for the poor. In Idaho, the gap is $8,600 versus $10. And in Georgia, the wealthy save $18,850 while the poorest get only $24.
What do these numbers mean in real life? Montana’s poorest residents could buy two gallons of milk with their $10 tax break. The wealthy could buy a used car with their $21,940.
“This isn’t tax relief that ordinary families can celebrate. For millions of America’s most vulnerable families, it’s a tax penalty, coming at a time when every dollar counts for groceries, rent, and keeping the lights on,” said Bourgi.
The pattern is the same across the country. High-income households consistently save $15,000 to $22,000. The poorest families are lucky to get $100. In most states, their tax break wouldn’t cover filling up their gas tank.
Even where the poor do get some relief, the gap is enormous. New Jersey’s wealthy save $22,160, but the poorest get only $130. In California, top earners pocket $21,950 while low-income families receive $70.
For the poorest, Trump’s tax breaks barely cover a few days of mortgage
In a handful of states, Trump’s tax bill does a little more to help the poorest homeowners, but only a little. In Minnesota, low‑income families get the most meaningful break: their tax relief covers about 3.6 days of a typical monthly mortgage payment, still less than a week.
New Hampshire, Alaska, New Jersey and Washington follow, where the poorest can cover roughly two to three days of mortgage with their annual tax savings.
Even in these best‑case states, the contrast with higher‑income households is significant. While low‑income families get just a few days of breathing room, middle‑income households can cover around a month of payments and the richest can wipe out seven to 14 months of mortgage with their tax breaks.
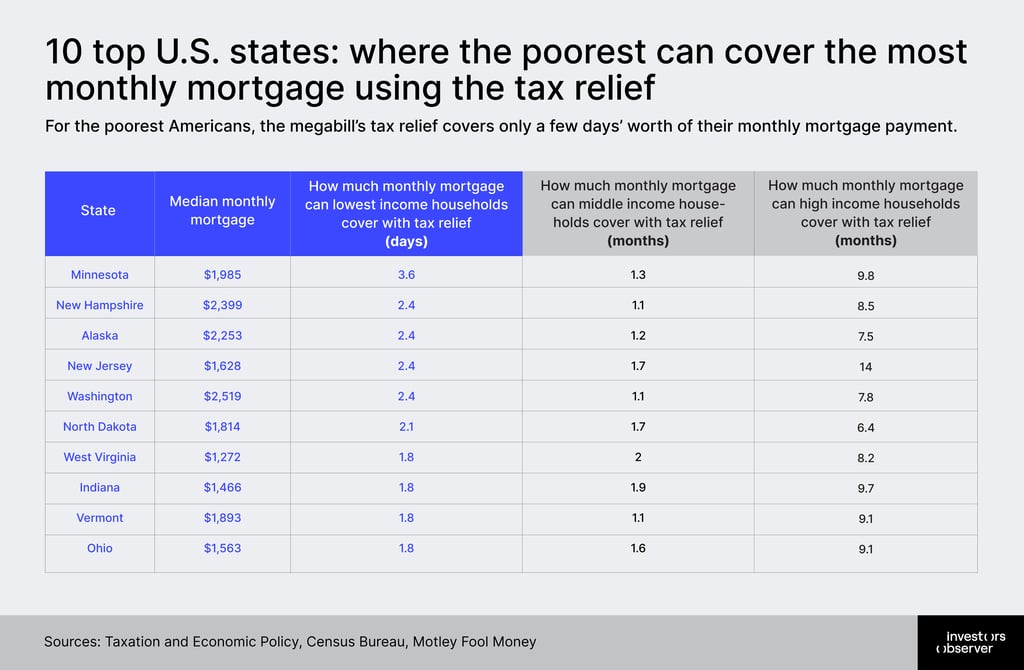
On the other hand, in eight states – California, New York, Hawaii, Maryland, Massachusetts, Oregon, New Mexico, and Colorado – the middle income tax break can’t even cover a month’s mortgage.
California’s middle-class families can save $2,130 a year – enough to cover just 21 days of mortgage payments.
That's less than three weeks of relief in a state where the median mortgage runs over $3,000 a month. Meanwhile, California’s wealthiest save $21,950 – enough to cover seven months of median mortgage, although they most likely have their own homes.
The story repeats across high-cost states. New York, Hawaii, Maryland, Massachusetts, Oregon, Colorado, and New Mexico all fail to deliver even one month of mortgage coverage to middle-income families through their tax savings.
Compare that to states like West Virginia, where middle-class tax breaks cover two full months of mortgage payments. Indiana delivers 1.8 months, and Kentucky provides 1.7 months. These aren’t wealthy states – they’re places where housing costs less and tax relief stretches further.
“Tax relief that can’t cover a single mortgage payment is more like a rounding error, not a real relief. For millions of middle-class families, that’s exactly what this tax bill delivers,” said Bourgi.
From $240 to $21,970: states where each income group gets the biggest tax relief
In Trump’s tax bill, where you live matters almost as much as how much you earn. Some states are far more generous than others, even if people are within the same income group.
Minnesota, Washington, New Hampshire, Alaska and New York deliver the biggest dollar tax breaks to the very poorest households, with low‑income families there getting between $160 and $240 a year.
For the middle class, a different map lights up. North Dakota, Wyoming, Connecticut, Washington and Illinois give middle‑income families the largest tax relief, from about $2,770 to just under $3,000 a year – enough in some places to cover a full month of mortgage payments, and in others only a couple of weeks.
Coastal states tell the opposite story. California, New York, Hawaii and Maryland deliver the weakest relief to middle‑class homeowners, despite their residents paying some of the highest housing costs in the country.
In lower‑cost states like West Virginia, a $2,000 tax break can mean two months of mortgage payments. In California, it barely covers three weeks.
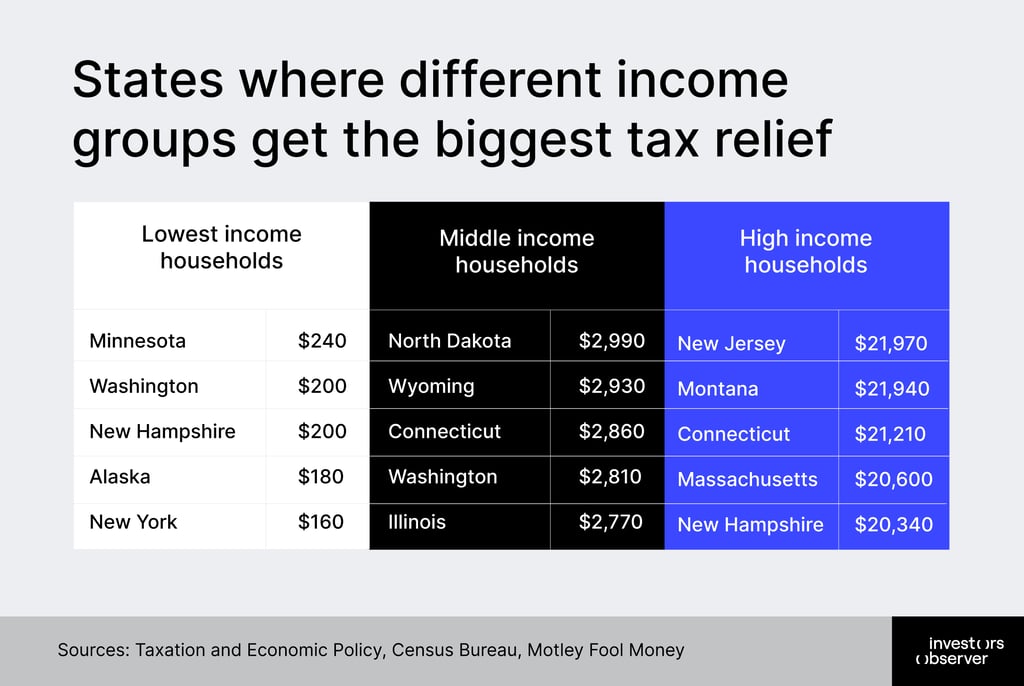
At the very top, another pattern appears. New Jersey, Montana, Connecticut, Massachusetts and New Hampshire deliver the biggest tax cuts for high‑income households, with breaks ranging from about $20,300 to nearly $22,000 a year.
That’s the kind of money that can wipe out months of housing costs or finance a big investment, dwarfing the few hundred dollars, at best, that poor and even middle‑class families see in those same states.
What it all means: when tax relief flows up, not down
The data shows a clear shift in who benefits from American tax policy. Across all 50 states, the pattern is that billions in tax savings flow upward to wealthy households while working families see pennies, or in eight states, actual tax increases.
The bottom 20% of Americans (roughly 25 million households struggling with rent, groceries, and medical bills) will receive negligible relief or none at all. Meanwhile, the top 5% will save heaps large enough to buy cars, pay off debt, or cover months of living expenses.
“Tax policy should reflect economic needs, not amplify economic inequality,” said Bourgi. “When the wealthiest save 2,000 times more than the poorest, we’re not talking about tax relief – we’re talking about wealth being redistributed upward.”
The geographic divide deepens existing inequalities. Coastal states with the highest costs of living deliver the least meaningful help to their middle class, while their wealthy residents capture the largest absolute savings.
Rural interior states see better relief ratios, but their overall savings are smaller in dollar terms. Either way, working families lose.
“This bill was sold as universal relief, but the data shows it’s anything but. In a country already facing historic wealth gaps, record housing costs and stagnant wages, Trump’s megabill widens the chasm between rich and poor – one tax break at a time,” concluded Bourgi.
Methodology and sources
We analyzed Trump’s “One Big Beautiful Bill” using data from the Institute on Taxation and Economic Policy (ITEP), a nonpartisan research organization that specializes in tax policy analysis.
ITEP used its microsimulation model – a tool that estimates how tax laws affect different income groups – to calculate who wins and loses under the new law.
All tax figures are annual: they show how much individuals will save or lose yearly in each state.
The data of median monthly mortgage cost by state was taken from Census Bureau and Motley Fool Money.
We translated tax savings into practical terms: how many months of mortgage payments could each group cover with their annual tax savings?
When tax savings exceed annual costs (like mortgage payments), we report it as months of coverage. For example, if someone saves $6,000 and their annual mortgage costs $3,000, their tax break covers 2 months of housing.
Income categories:
- Bottom 20% (average yearly income: $15,200) – lowest income (poor)
- Fourth 20% (average yearly income: $121,000) – middle income (middle class)
- Next 4% (average yearly income: $530,400) – high income (near-wealthy)
Limitations
Expense data (mortgage, food, transportation) represents national averages, not state-specific costs. California mortgages cost far more than West Virginia mortgages, which is why the same dollar amount in tax savings translates to different real-world relief.
We focused on three income groups to tell a clear story about inequality, but ITEP's data includes all five income quintiles.
This analysis looks only at the tax provisions of the megabill, not the additional impact of Trump’s tariffs, which economists estimate will increase consumer costs and offset some tax savings for working families.