Research: The same Easter budget now buys 40% less candy than in 2020

Since the start of this decade, the Easter basket has lost nearly half its candy, even as Americans spend more to fill it.
A new InvestorsObserver analysis of popular Easter candy prices confirms what many families have felt: the money isn’t stretching like it used to.
Since 2020, shoppers have increased their Easter candy budgets by about 15%, according to the National Retail Federation (NRF). But we found that prices jumped 67%.
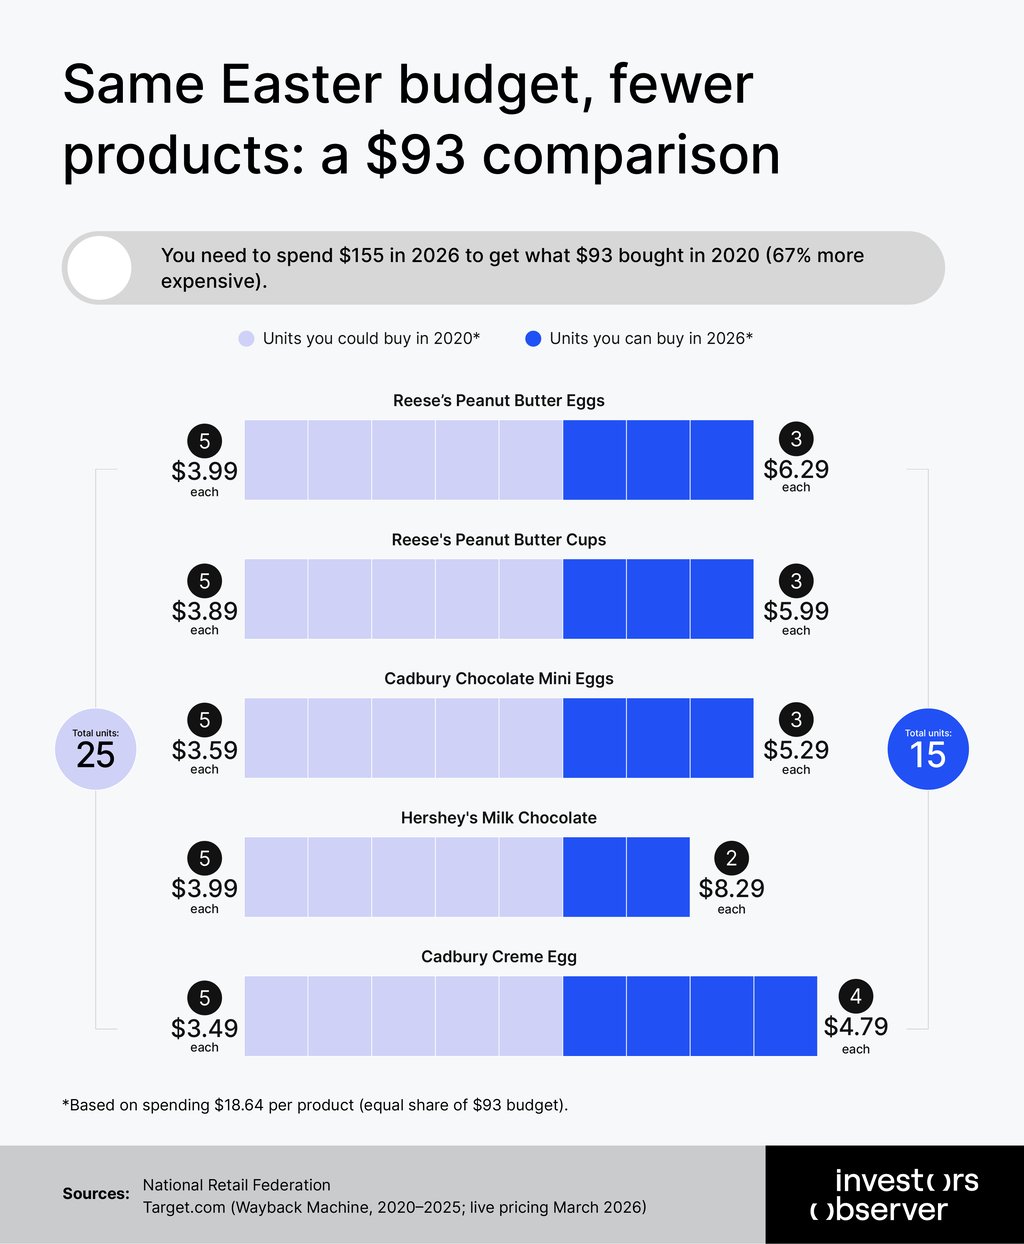
That gap means a family spending the same $93 on Easter candy today walks away with 40% less than six years ago.
It didn’t happen all at once. Small price bumps year after year – a few percent here, a quarter there – added up without setting off alarms.
Meanwhile, some brands quietly shrank their packages. Others swung prices unpredictably, making “normal” impossible to track.
To pin down the change, we tracked five popular Easter candy brands – Reese’s Peanut Butter Eggs, Cadbury Mini Eggs, Hershey’s Milk Chocolate, Reese’s Peanut Butter Cups, and Cadbury Creme Eggs.
The pattern held across brands: steady, incremental changes that consumers absorbed without recognizing the total impact.
Key findings
- The same Easter budget now buys 40% less candy than in 2020.
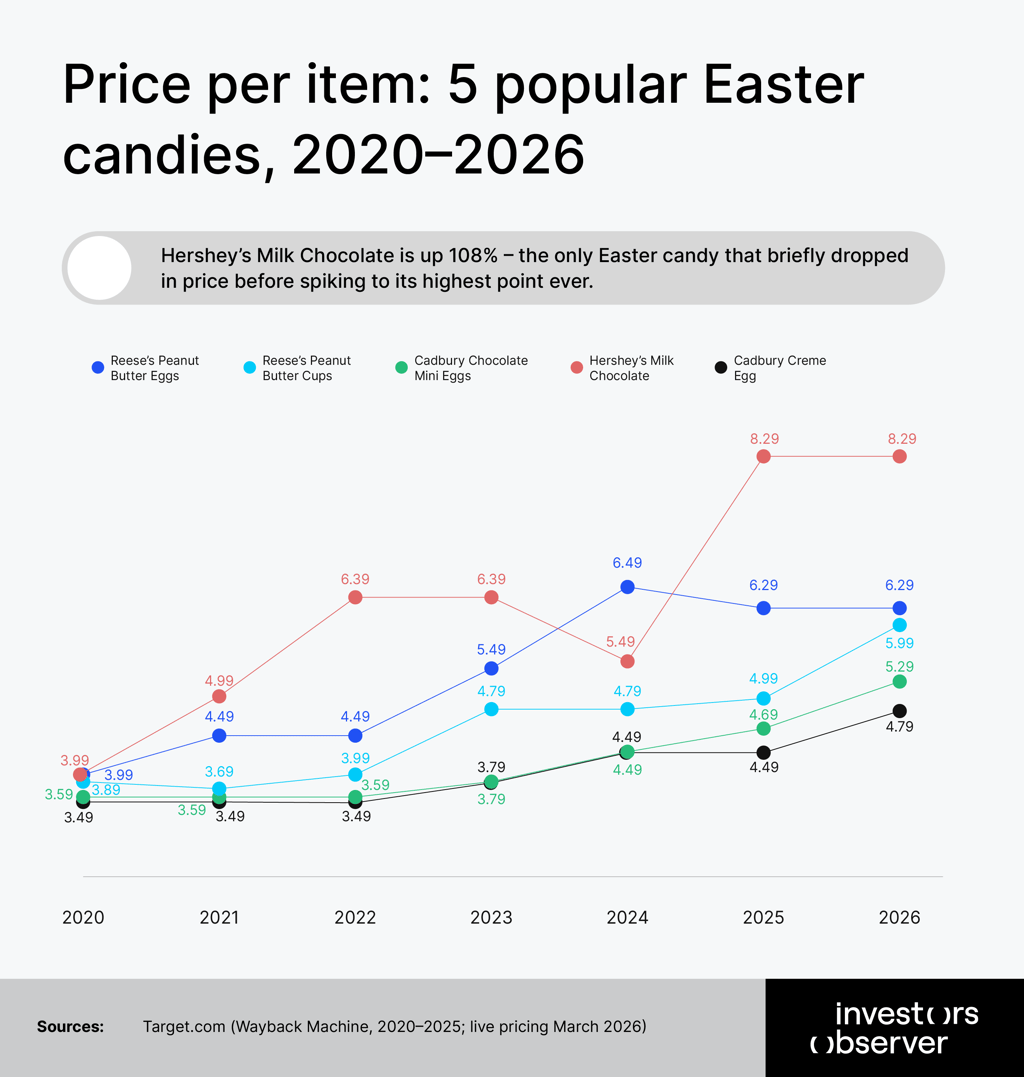
- In 2020, Easter candies ranged from $3.49 to $3.99, and by 2026, that gap exploded to $4.79 to $8.29.
- Shoppers increased their Easter candy budgets by 15% since 2020, while prices rose 67%.
- Hershey’s Milk Chocolate bars cost $8.29 today versus $3.99 in 2020 – more than double the price for the exact same size bar.
- Cadbury Mini Eggs shrank from 10oz to 9oz in 2022 with no price change – a hidden cost increase most shoppers never noticed.
The boiling frog effect: shoppers raised budgets 15%, but prices gradually rose 67%
Easter shoppers increased their budgets by 15% since 2020, unaware that prices jumped 67%, quietly diminishing their purchasing power.
The disconnect stems from how price increases accumulated over time. Year-over-year changes appeared moderate: 0% in some periods, 12% in others, then 0% again, followed by 22%. Each individual increase seemed manageable and didn’t trigger major concern among buyers.
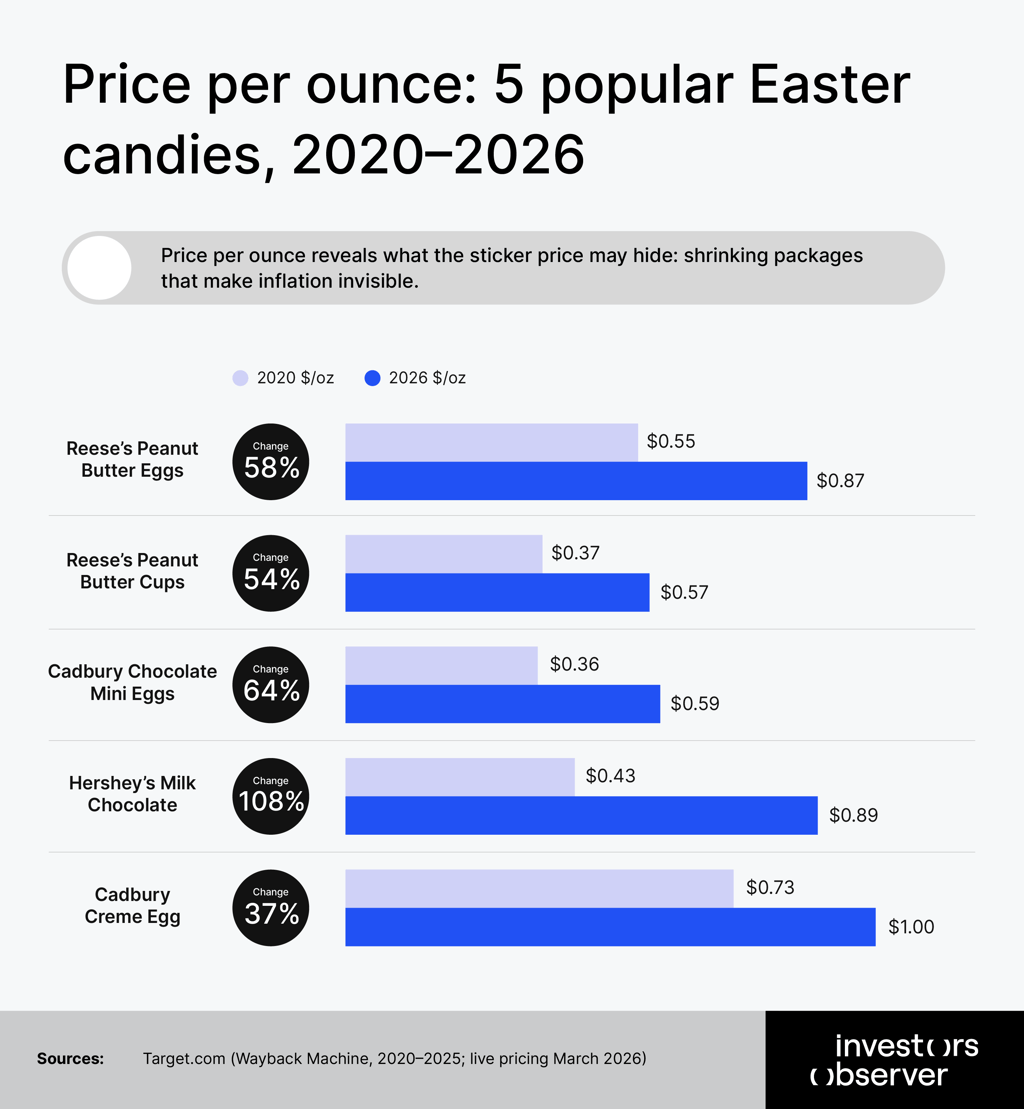
However, the cumulative effect shows that the change has been significant. Between 2020 and 2026, the average price per ounce across five tracked Easter candies increased from $0.37 to $0.62.
“It’s the classic boiling frog scenario that actually shows up in groceries year-round. You don’t jump out of the pot because the water heats up one degree at a time. Each individual increase feels tolerable – annoying, maybe, but not catastrophic. So you adjust. By the time you realize how hot the water has gotten, you’ve already lost significant purchasing power,” explained Sam Bourgi, senior analyst at InvestorsObserver.
The perception gap becomes clear in the spending data. According to NRF surveys, the average American increased per-person Easter candy spending from $23.30 in 2020 to approximately $26.82 in 2025.
“That 15% increase suggests consumers believed they were adjusting appropriately to market conditions,” said Bourgi.
The reality differs significantly. A 67% per-ounce price increase means the 15% budget adjustment fell short by more than $50 in purchasing power. Americans increased nominal spending while actual buying capacity declined.
“That’s how this happened without anyone noticing. Not because shoppers weren’t paying attention. Because the increases were designed – intentionally or not – to fly under the radar of how people track spending: in total dollars, not in what those dollars actually buy,” explained Bourgi.
Hershey’s: same bar, double the price – with a cruel twist
The Hershey’s Milk Chocolate bar stands out as the most extreme case in the research, with a 107.8% price-per-ounce increase over six years. The package size never changed – shoppers got the same 1.55-ounce bar throughout. Only the price moved, and it moved a lot.
What makes Hershey’s trajectory particularly notable is the pattern. The price grew steadily from $3.99 in 2020 to $6.39 by 2022. Then in 2024, it dropped to $5.49 – a $0.90 decrease that suggested relief might be coming. That relief lasted one year. By 2025, the price had jumped to $8.29, surpassing all previous levels.
“When a price drops and then spikes even higher, it feels more unfair than a steady increase. The drop resets your expectations (you think things are getting better) which makes the spike feel manipulative rather than just market-driven,” said Bourgi.
The $4 Easter candy is gone, and so is your sense of a fair price
For years, American shoppers had a reliable mental anchor: Easter candy costs around $4. That simple reference point made decision-making easy.
A bag for $3.79 was considered a good deal, while one for $5.99 was too expensive. The narrow 50-cent price range meant a shopper’s instinct was usually right.
That shortcut is gone. In 2020, prices clustered between $3.49 and $3.99. By 2026, that spread had exploded to $4.79 to $8.29 – a range seven times wider. The same type of candy now costs wildly different amounts depending on the brand.
“When shoppers lose a reliable sense of what something should normally cost, everything gets harder. Instead of grabbing the usual bag without a second thought, you’re suddenly comparing prices, doing per-ounce math in your head, and wondering if you’re being overcharged,” explained Bourgi.
The data shows this isn’t a temporary disruption. The price spread has been widening consistently, and the tight clustering of 2020 shows no signs of returning. Shoppers now face a very different pricing environment – one that requires more attention, more skepticism, and more work to navigate.
What this means for people’s wallets
The numbers add up to real dollars lost, and show how American families are giving up purchasing power.
A family spending the same $93 on Easter candy as in 2020 now gets about 40% less candy by weight. Same budget, lighter basket.
In 2020, Easter candies ranged from $3.49 to $3.99 – a tight window that made it easy to spot good and bad deals. By 2026, that range had exploded to $4.79 to $8.29. Similar products now vary by several dollars, making it harder to know what’s reasonable.
“People are terrible at noticing prices creeping up slowly,” said Bourgi. “A 12% increase one year, nothing the next, then 22% – each bump feels survivable. But add them up over six years, and suddenly you’re paying 67% more without ever feeling like you hit a breaking point.”
Easter candy is one small, seasonal category. But the same patterns – gradual price increases, shrinking packages, unpredictable pricing – show up in groceries, household goods, and everyday essentials. The cumulative effect across a year of shopping is significantly larger.
When prices were consistent, grabbing the usual products was simple. Now, getting fair value requires checking price-per-ounce, comparing package sizes, and tracking what items used to cost. Without that effort, it’s easy to pay more without realizing it.
To buy the same volume of candy (by weight) purchased in 2020, a household would need to increase spending from $93.20 to approximately $155 in 2026 – a $62 increase for identical product volume. Buying the $93.20 budget results in receiving 101 fewer ounces of candy.
“Six years of incremental price increases, shrinking packages, and shifting price ranges have reshaped what an American Easter tradition costs, not in one dramatic moment that might have prompted outrage, but in the slow, invisible way that leaves families spending more and getting less, year after year, without ever quite seeing it happen,” pointed out Bourgi.
Methodology and sources
The candies we tracked
We analyzed five of America’s most popular Easter candies, based on Instacart’s top sellers during Easter weekend 2024:
- Reese’s Peanut Butter Eggs (6-pack, 7.2oz)
- Reese’s Peanut Butter Cups Snack Size (10.5oz)
- Cadbury Mini Eggs (10oz, later shrunk to 9oz)
- Hershey’s Milk Chocolate Bars 6-pack (9.3oz)
- Cadbury Creme Eggs 4-pack (4.8oz)
Where the prices came from
All prices were collected from Target.com. For historical data (2020–2025), we used the Wayback Machine (web.archive.org), pulling archived Target listings from February through April of each year. The 2026 price reflects the live Target.com listing as of March 2026.
Why these five products
We chose candies that appeared on Instacart’s bestseller list and had consistent Wayback Machine snapshots available over multiple years, allowing for reliable year-over-year comparison.
How we calculated the numbers
Price per ounce = listed price ÷ package size in ounces
Year-over-year change = percentage difference in price, size, or price per ounce from one year to the next
Baseline comparison = 2020 prices vs. 2026 prices
How we built the household budget model
We used the National Retail Federation’s 2020 figure for per-person Easter candy spending: $23.30. Multiplied by four (for a family of four), that's $93.20.
We divided that budget equally across all five products, calculated how many units $93.20 would buy in 2020, then priced those same quantities at 2026 prices to find the increase.
How we measured shrinkflation
For products that changed size (like Cadbury Mini Eggs, which dropped from 10oz to 9oz), we calculated the hidden cost: what shoppers lost by getting a smaller package at the same or higher price.
How we measured purchasing power loss
We calculated a weighted average price-per-ounce change across all five products, giving more weight to larger packages. We then applied that average to the $93.20 household budget to estimate how much less candy the same money buys in 2026.
Limitations
- All prices come from Target.com. Prices at Walmart, grocery chains, or discount stores may vary.
- Archived snapshots have gaps. The Wayback Machine may not capture short-term sales or promotions. For example, Hershey’s price dip in 2024 ($5.49 vs. $8.29 in 2025) could reflect a promotional price or snapshot timing rather than a sustained change.
- The budget split is simplified. The household model divides the Easter candy budget equally across five products. In reality, shoppers may spend more on some favorites than others.
- Limited shrinkflation data. Only one of the five products (Cadbury Mini Eggs) changed package size during the study period. This makes the analysis primarily a price inflation study, not a comprehensive shrinkflation analysis.
- Spending figures are estimates. The National Retail Federation data used for household budgets comes from consumer surveys, not actual transaction records.