Research: Stocks and gold turned $1,000 into $4,000 over a decade, while contemporary art lost money

While fractional investing platforms have mainstreamed the idea of building wealth through fine art, a new study by InvestorsObserver reveals that everyday investors would have been better off sticking to traditional assets, such as gold or stocks, which have far outpaced fine art over the past decade.
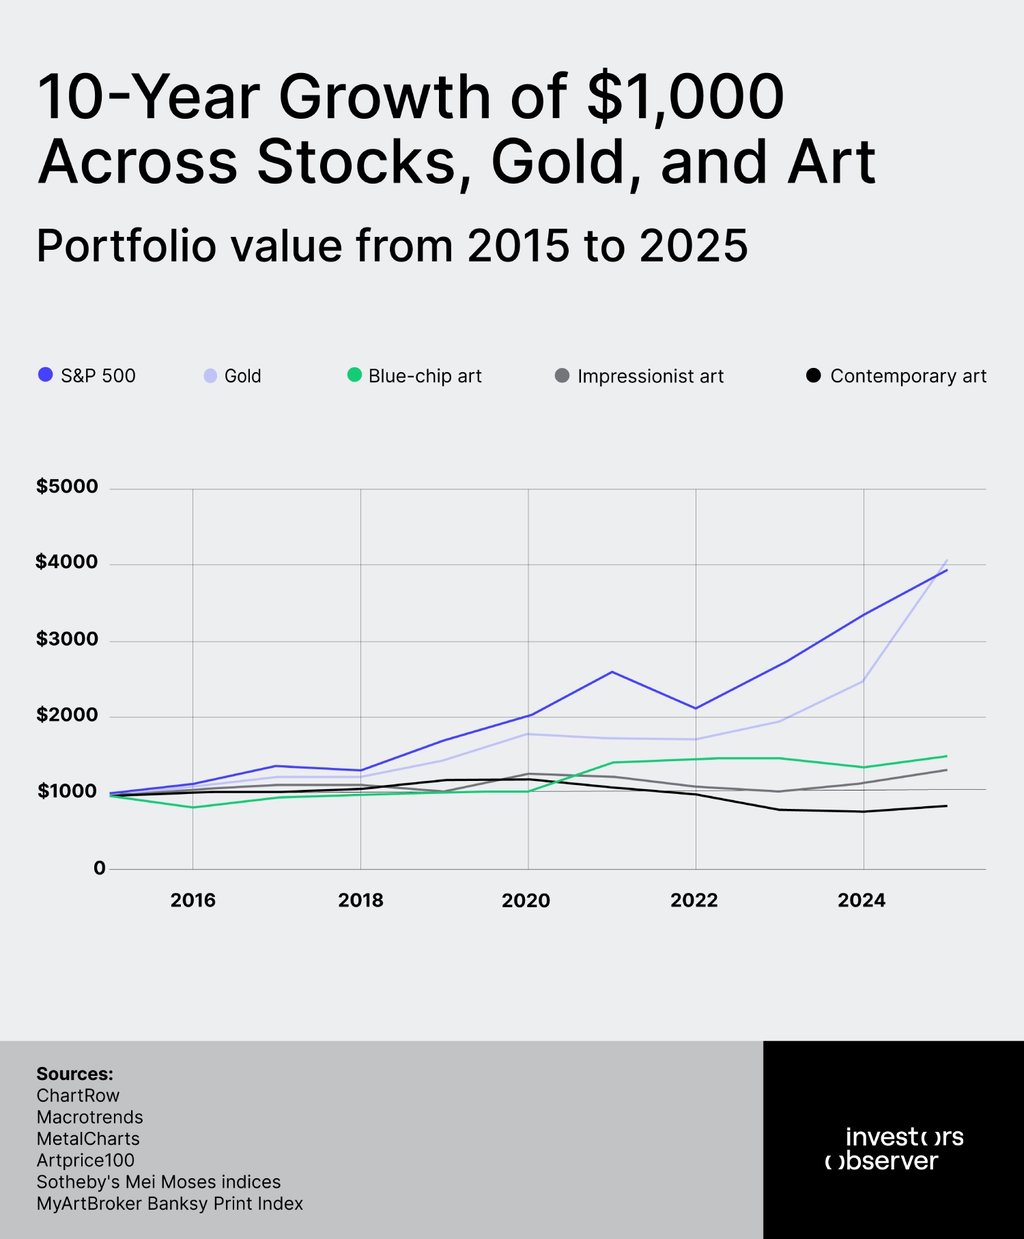
Over the past decade, a $1,000 investment in either the S&P 500 or gold grew to approximately $4,000. By contrast, the same amount invested in blue-chip art reached just $1,501, while contemporary art shrank to just $835.
To see how each performed in real dollar terms, InvestorsObserver tracked how a $1,000 investment grew or shrank across stocks, gold, and major art categories.
Key findings:
- A $1,000 investment made at the end of 2015 grew to $3,942 in the S&P 500 and $4,078 in gold by the end of 2025.
- Over the same 10-year period, $1,000 in contemporary art fell to $835.
- Over 10 years, Impressionist art reached $1,306 and blue-chip art reached $1,501.
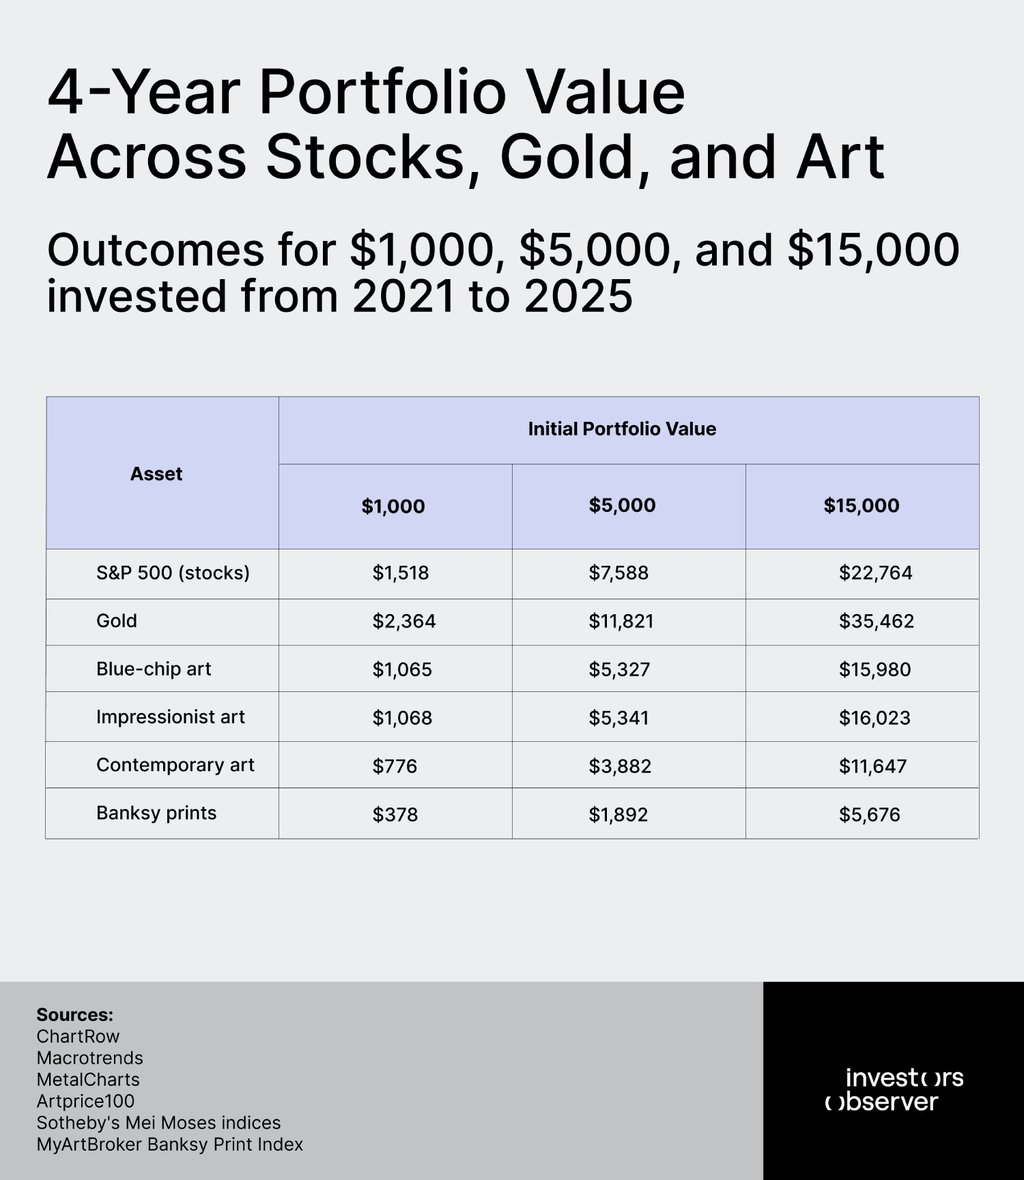
- Between 2021 and 2025, a $1,000 investment in Banksy prints collapsed to $378.
- Since 2000, blue-chip art has moved hand in hand with the stock market (a correlation of 0.88), meaning it has failed to protect investors during downturns.
Traditional assets quadrupled in a decade, leaving art far behind
Over the past 10 years, through the end of 2025, both gold and the S&P 500 delivered strong growth. The S&P 500 rose 14.7%, while gold gained 15.1% per year.
This means that for someone who invested $1,000 in these assets, it would have grown to $3,942 in stocks and $4,078 in gold, roughly quadrupling the initial investment.
However, while both assets show similar growth over the decade, gold surpassed stocks due to a surge at the end of 2025, rising from $2,625 to $4,323 per ounce.
In 2026, momentum has shifted, and while stocks continue to rise, gold is slowing and has dipped to $4,162.58 per ounce as of October.
By comparison, investments in art generated much lower returns over the same time period, with contemporary art even losing investors money.
Beyond lagging in returns, art also falls behind traditional investments when an owner actually needs to convert that investment into cash.
According to Sam Bourgi, InvestorsObserver financial analyst, an artwork is only worth what someone is willing to pay for it, and finding that person can take time.
“Fine art tends to be a poor place to keep money that might be needed in an emergency. On the other hand, widely traded stocks and funds can generally be sold during market hours, although withdrawing the proceeds takes additional time. Standard gold coins and bars also have a much more established resale market.’
Contemporary art lost money over the decade
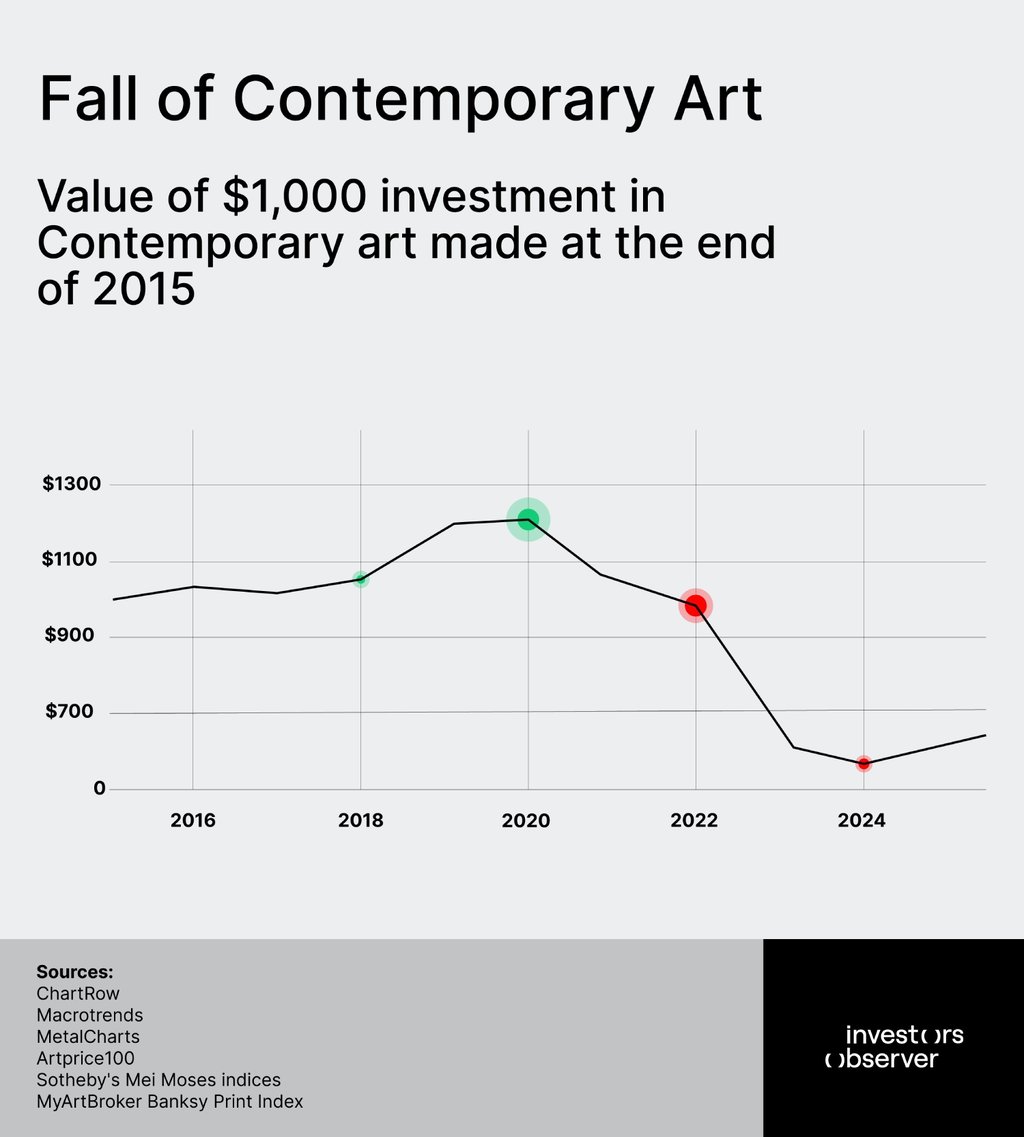
Contemporary art was the weakest performer among the art categories studied by InvestorsObserver. As tracked in the Sotheby's Mei Moses index, this category fell by an average of 1.8% per year.
In practical dollar terms, a $1,000 investment rose steadily to $1,190 by the end of 2020 and peaked shortly after, giving early buyers the illusion of steady gains. However, it eventually fell to $835 in 2025.
Banksy prints lost 62% of their value
Over four years, street art suffered steeper losses than contemporary art did over a decade, though its market has a shorter track record.
Because limited-edition prints cost a fraction of a painting, Banksy prints became a popular way for everyday collectors to chase market hype.
According to MyArtBroker's Banksy Print Index, prices rose briefly in early 2022 before falling steadily over the next few years, losing more than half their value.
In practical dollar terms, a $1,000 investment at the end of 2021 fell to just $378 in 4 years. Over that same time, this amount would have grown to $1,518 in stocks and $2,364 in gold.
Blue-chip art: large investments for modest returns
Not every art category lost money, though the gains in top-tier art were still modest. Blue-chip art refers to works by the most established and world-famous artists, such as Pablo Picasso, Andy Warhol, and Jean-Michel Basquiat.
Tracked by the Artprice100 index, this market grew by an average of 4.1% per year. In dollar terms, that meant a $1,000 investment grew to $1,501 over a decade.
However, buying an actual artwork in this category can cost $250,000 and more, putting it out of reach for the average beginner investor.
For those who want to invest smaller amounts, there are fractional investing platforms that allow investing in $20 increments, so a very small piece by a Picasso or a Warhol can become within reach.
According to Sam Bourgi, art’s association with the ultrawealthy can make it look like a route to getting rich. Record auction prices reinforce this impression, while pieces that lose value or fail to sell receive far less attention.
“For wealthy collectors, art can serve several purposes, including personal enjoyment, borrowing against a collection, and passing assets to family. The 2026 Art Basel and UBS survey found that collectors with more than $50 million in net worth held an average of 23% of their wealth in art.
Around 20% of all collectors surveyed had used artwork as security for a loan. These figures describe people already wealthy enough to collect art, rather than people who became wealthy by buying it.”
A wealthy household can afford to hold a painting for years without finding a buyer. Someone trying to build their first savings has very different needs.
The steadiest bet in art
While blue-chip art experienced sharp swings, Impressionist art has been the steadiest among all art categories. A $1,000 investment never fell below its starting value at any year-end.
Auction price trackers show that between the end of 2015 and the end of 2025, Impressionist art grew by an average of 2.7% per year. In practical terms, a $1,000 investment grew to $1,306.
However, these returns are before accounting for any buying, selling, or holding costs. So while it outperformed contemporary art, which lost money, the returns still do not match those of traditional investments.
Art isn’t the best diversification option
Art also failed to protect everyday investors' savings during stock market declines. Since 2000, blue-chip art has had a correlation of 0.88 with the S&P 500.
In plain terms, correlation measures how closely two investments move together on a scale from -1 to 1, where 1 means they move in the same direction. At 0.88, blue-chip art rose and fell alongside stocks rather than serving as a safety net.
Leaving art as not the greatest option for diversification, nor for the first investment. Owning art comes with steep expenses that eat into profits.
Unlike stocks or gold, which can be bought and sold in seconds, physical art requires paying auction commissions, sales taxes, insurance, and specialized storage.
For those looking to invest their first $1,000, Bourgi suggests first checking whether the money is available to invest.
“Someone with no emergency savings may be better off keeping it in an insured savings account. Expensive credit card debt also deserves attention before taking investment risk. Once those basics are covered, a low-cost, broad index fund can be a sensible starting point for long-term savings. Adding money regularly is more useful than spending months trying to find the perfect first investment.”
Methodology & Limitations
InvestorsObserver modeled the nominal U.S. dollar performance (unadjusted for inflation) of a hypothetical $1,000 investment across the S&P 500, gold, and four art segments: blue-chip, Impressionist, contemporary, and street art (Banksy prints).
- Timeframes: A 10-year window (December, 2015, to December, 2025) for all assets except Banksy prints. A 4-year comparison (2021–2025) was calculated for Banksy prints to align with the available index history.
- Data Sources: S&P 500 annual total returns with dividends reinvested (ChartRow); gold prices (Macrotrends; MetalCharts for 2025); and art values from the Artprice100, Sotheby’s Mei Moses, and the MyArtBroker Banksy Print Index.
- Calculation: Each amount is multiplied by the change in the asset's value from the start to the end of the period. The annual growth rate is the steady yearly rate that yields the same result.
- Limitations: These figures exclude auction fees, taxes, insurance, storage, and unsold or private pieces. Several art indices sit behind paywalls; the analysis relies on select published series and aligns differing index start dates to calendar year-ends. Artprice100 cannot be purchased directly, and the Banksy index is compiled by a commercial marketplace that sells those prints.