
Periods of geopolitical conflict have long been catalysts for volatility and opportunity in financial markets. For retail investors, understanding how key sectors respond to war is essential for navigating risk and identifying resilient assets.
Investors Observer’s research team has conducted a quantitative analysis of the S&P 500 energy and the S&P 500 Aerospace & Defense sectors across major modern conflicts: Iraq’s invasion of Kuwait (1990), 9/11 terrorist attacks (2001), Russia’s invasion of Ukraine (2022), Iran’s missile attack on Israel (2024), and Israel's attack on Iran (2025), also known as Operation Rising Lion.
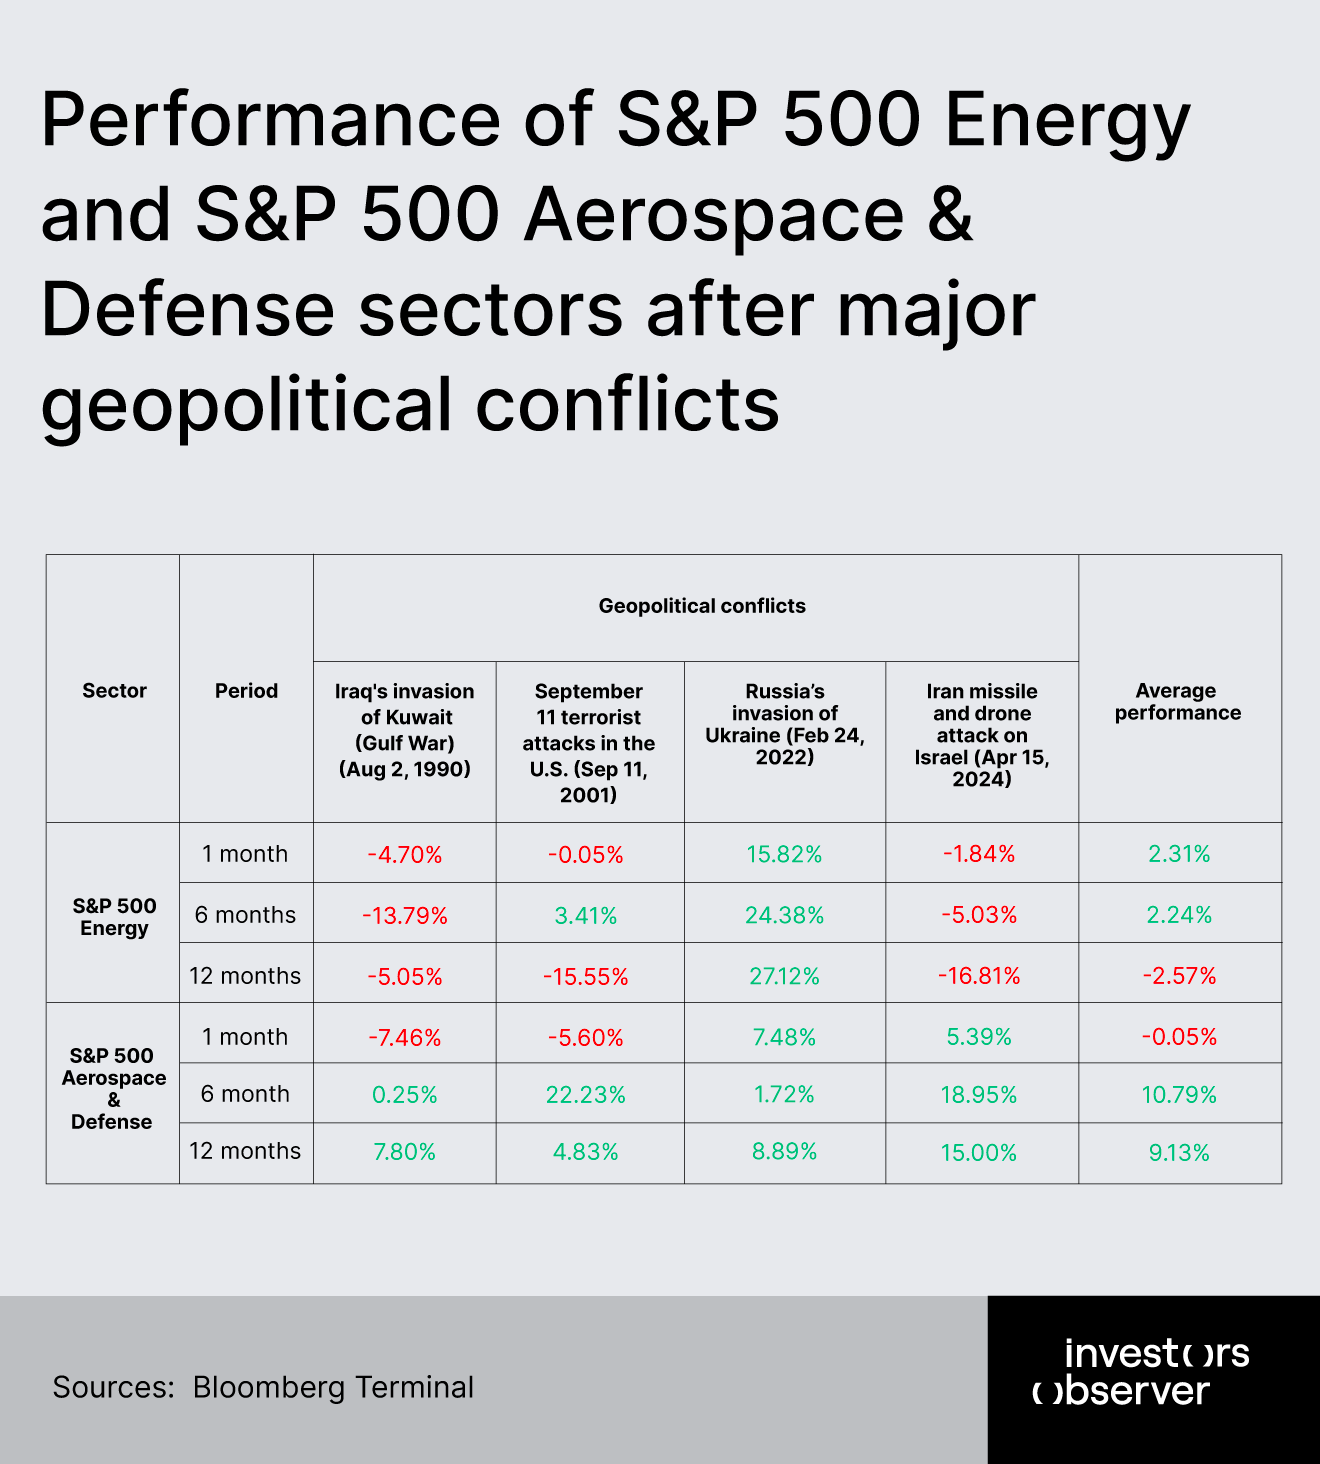
We examined returns over one month, six months, and twelve months following each event.
This article delivers data-driven insights into sector performance, highlights patterns of resilience and vulnerability, and discusses the implications for retail investors seeking to position their portfolios for turbulent times.
Key findings
S&P 500 energy sector:
- 1 month average performance after conflict: +2.3%
- 6 months average performance: +2.2%
- 12 months average performance: –2.6%
- During the Ukraine war, 12-month return surged to +27.1%; in Operation Rising Lion (Israel vs. Iran, 2025), the sector fell –2.9% in one week.
S&P 500 aerospace and defense industry:
- 1 month average performance: 0%
- 6 months average performance: +10.8%
- 12 months average performance: +9.1%
- Only the first month after the Gulf War and 9/11 showed declines (–7.5% and –5.6% respectively); all other periods were positive or flat.
S&P 500 Energy: volatility, opportunity, and limits
The S&P 500 Energy sector’s response to war is marked by pronounced volatility and event-specific swings. In the immediate aftermath of conflict, energy stocks do not always act as a reliable hedge.
For example, during the 2025 Israel-Iran escalation, the sector dropped nearly 3% in a single week, mirroring a more than 4% decline in WTI crude oil prices. Yet, the sector’s longer-term performance can be robust if the conflict disrupts global oil supply chains or triggers sustained commodity price rallies.
This was most evident during the Ukraine war, when the sector delivered a remarkable 27.1% gain over twelve months, reflecting the market’s reaction to severe supply shocks and Western sanctions on Russian energy exports.
However, the data also reveal that such outperformance is not the norm. Averaged across four major conflicts, the sector’s twelve-month return is –2.6%, indicating that any initial rally may fade as markets adapt and risk premiums normalize.
The sector’s one-month and six-month average returns are modestly positive (+2.3% and +2.2%, respectively), suggesting that energy stocks can benefit from short-term uncertainty and price spikes, but these gains are not consistently sustained.
Notably, the sector’s performance is closely tied to the nature and duration of each conflict, the involvement of major oil-producing nations, and the subsequent policy responses from governments and central banks. For retail investors, this means that while energy stocks can offer tactical opportunities during crises, they should not be viewed as a foolproof safe haven.
S&P 500 Aerospace & Defense: consistent outperformance in crisis
In contrast, the S&P 500 Aerospace & Defense industry has demonstrated a more reliable pattern of positive returns in the wake of major conflicts. Excluding the first month after the Gulf War and 9/11, when the index dropped by 7.5% and 5.6% respectively, the sector consistently posted gains over six and twelve months, with average returns of +10.8% and +9.1%.
This resilience is rooted in the sector’s direct exposure to increased government defense spending, contract awards, and heightened investor interest during times of geopolitical stress.
The defense sector’s ability to outperform even as broader markets struggle emphasizes its value as a strategic allocation for investors seeking both diversification and downside protection during periods of elevated risk.
Implications for investors
For retail investors navigating turbulent periods marked by war or geopolitical crises, the evidence from the S&P 500 Energy and the S&P 500 Aerospace & Defense sectors points to several actionable implications.
First, the S&P 500 Energy sector’s performance is highly event-driven and inconsistent as a defensive allocation. While the sector delivered a standout 27.1% return over twelve months following the Ukraine war, this is the exception, not the rule.
In other conflicts, such as the recent Israel-Iran hostilities, energy stocks fell nearly 3% in just one week, and the long-term average across four major conflicts is actually negative at –2.6% after a year.
This emphasizes that energy stocks are not a reliable hedge against geopolitical risk and are often more sensitive to the specifics of supply disruption and commodity price swings than to conflict itself.
In contrast, the S&P 500 Aerospace & Defense industry has shown a more consistent pattern of resilience and outperformance.
Despite short-term losses in the first month after the Gulf War and 9/11, the sector posted robust average returns of 10.8% over six months and 9.1% over twelve months. This reflects the industry’s direct exposure to increased government spending and procurement cycles that typically follow major military escalations.
The time horizon is critical. Energy stocks may offer tactical upside in the immediate aftermath of a crisis, but their gains often prove fleeting unless the conflict causes prolonged supply shocks. Defense stocks, meanwhile, tend to build momentum over a longer period as policy responses and spending filter through the sector.
Therefore, investors should avoid blanket assumptions about “war hedges” and instead focus on diversification and event-specific analysis. Defense stocks offer a more reliable way to position for geopolitical risk, but no sector is immune to volatility or policy shifts.
Tactical allocations – rather than permanent bets – are most prudent, and any move into these sectors should be informed by the unique characteristics of each conflict and the broader macroeconomic environment.
Methodology and sources
Performance data was sourced from the Bloomberg Terminal with calculations beginning on the event start date for each asset. Only in relation to the 9/11 terrorist attack, calculations began using data from September 10.
Returns reflect price changes only, excluding dividends or currency adjustments. For the Operation Rising Lion, the data used for calculations covered the period from June 13 to June 24.
Your email address will not be published. Required fields are markedmarked