
In the past few years, the American housing market has changed quickly and dramatically.
New research from InvestorsObserver shows that between 2021 and 2025, 39 major metro areas across the country – spanning both red and blue states – flipped from being places where buying a home was cheaper than renting, to where renting is now the more affordable option.
This shift directly affects millions of everyday Americans, changing how they budget for housing and plan their futures.
For families across many cities, the cost of owning a home has surged far beyond renting. Mortgage payments have skyrocketed, often doubling or more, while rent has risen at a slower pace.
This means that many people who hoped to buy a house are now stuck renting or facing much higher monthly costs than they expected. This is a major change in how Americans experience housing costs.
This report helps families make sense of a new reality where the old rules of “buy versus rent” no longer apply, reshaping the housing market across the nation.
Key findings
- In 2021, 39 out of 50 major metros had a negative buy-rent gap, meaning it cost less to buy than to rent.
- By 2025, every metro showed a positive gap, making renting universally cheaper.
- Average monthly mortgage payments rose about 100% or more in many top metros (Miami +219%, San Francisco +103%, Oklahoma City +167%), while typical rent growth lagged far behind.
- The average buy-rent gap in the 10 highest-gap metros tripled, rising from around 35% in 2021 to about 110% in 2025.
- Even bottom-five metros in 2025 – traditionally more affordable – no longer favored buying as their rent-buy gaps hovered around 0.1 to 0.5, still making renting the less costly option.
- Nationally, the overall average gap flipped from –7% in 2021 (favoring buying) to +53% in 2025 (favoring renting), an extraordinary reversal unseen in previous housing cycles.
Top 10 metro areas by largest increase in buy-rent gap (2021-2025)
In April 2021, the American housing market was still benefiting from rock-bottom mortgage rates and relatively constrained rent growth – a convergence that made buying at least as attractive, if not cheaper, than renting in most metro areas.
In fact, 39 of 50 major metros had a negative buy-rent gap. Put plainly, owning a home came with a monthly discount. Fast forward to 2025, and this dynamic has been obliterated: every major metro flipped to a positive gap, with renting now the better deal across the board.
This universal reversal marks a broad, structural shift: the era when the majority of U.S. metros favored homeownership for financial reasons has ended, at least for the foreseeable future.
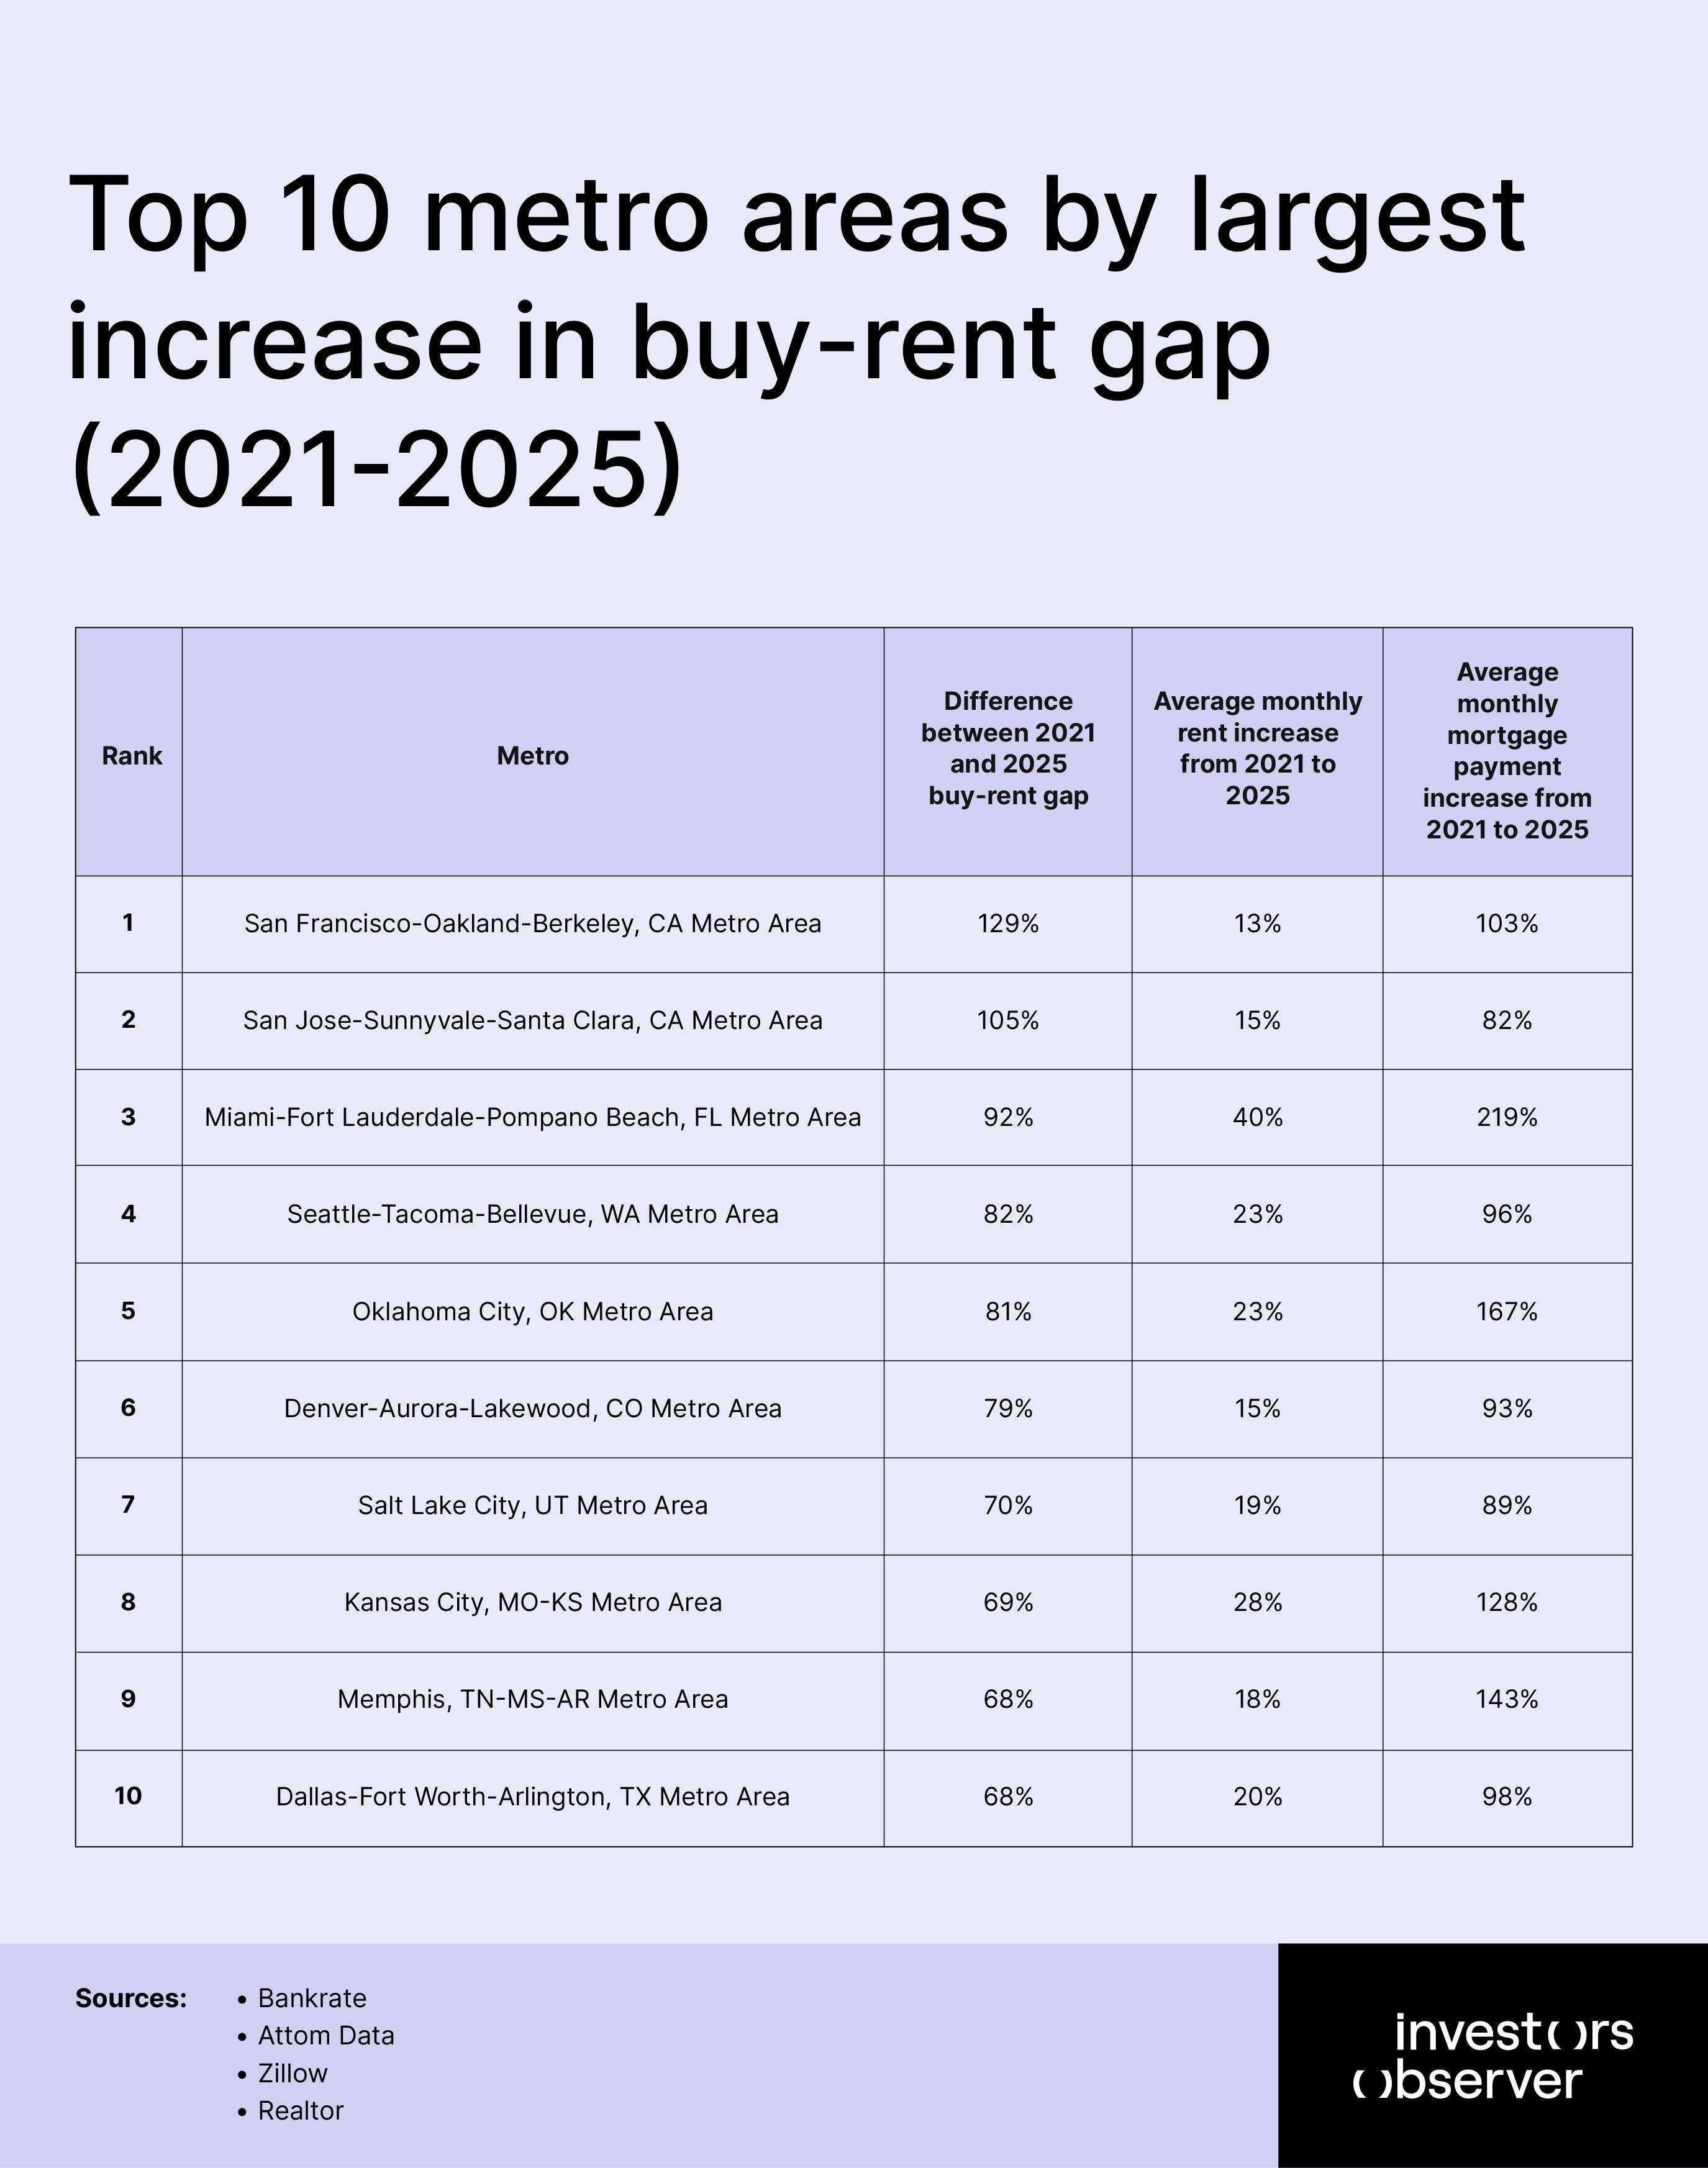
San Francisco-Oakland-Berkeley, CA Metro Area
San Francisco leads with the most dramatic increase in buy-rent gap, rising by 129% from 2021 to 2025. In 2021, the metro had a buy-rent gap of 62%, meaning buying was moderately more expensive than renting.
By 2025, this gap exploded to 190.7%, indicating buying became nearly twice as expensive as renting. The average monthly rent increased modestly from $2,708 to $3,055, representing a 12.8% increase.
However, mortgage payments skyrocketed from $4,383 to $8,882, a staggering 102.7% increase that doubled monthly housing costs for buyers. This dramatic shift transformed San Francisco from having a manageable buy-rent differential to becoming one of the most prohibitive markets for homebuyers in the nation.
The data shows that while rent prices remained relatively stable with modest growth, the combination of rising interest rates and surging home prices made purchasing property financially unrealistic for most residents.
San Jose-Sunnyvale-Santa Clara, CA Metro Area
The heart of Silicon Valley experienced the second-largest increase in buy-rent gap, with a rise of 105% between 2021 and 2025. Starting from an already elevated buy-rent gap of 80% in 2021, the area reached 185.6% by 2025. Monthly rents increased from $2,872 to $3,305, representing a 15.1% growth over the four-year period.
Meanwhile, mortgage payments surged from $5,175 to $9,438, an 82.4% increase that nearly doubled homeownership costs. Despite being slightly lower than San Francisco's percentage increase, San Jose's mortgage payments reached the highest absolute levels compared to other metros.
The area's tech-driven economy and limited housing supply contributed to these extreme conditions. The data reveals that even high-income tech workers in this region face significant challenges when choosing between renting and buying, with purchasing a home requiring substantially higher monthly commitments than renting comparable properties.
Miami-Fort Lauderdale-Pompano Beach, FL Metro Area
Miami experienced a remarkable transformation in its housing market dynamics, with a buy-rent gap increase of 92% points. The most striking aspect of Miami's change is that it moved from a negative buy-rent gap of -0.28% in 2021 to a positive gap of 63.5% in 2025.
This means the market shifted from favoring homebuying to favoring renting. The area recorded the highest rent increase among the top 10 metros, with monthly costs rising from $1,946 to $2,721, a substantial 39.8% increase.
However, the mortgage payment surge was even more dramatic, jumping from $1,393 to $4,449, representing an unprecedented 219.4% increase – the highest percentage increase among the 50 analysed metros.
This massive shift reflects Miami's emergence as a major destination for relocated workers and investors, creating intense pressure on both rental and purchase markets, but disproportionately affecting buyers due to rapidly appreciating home values and higher mortgage rates.
Seattle-Tacoma-Bellevue, WA Metro Area
The Pacific Northwest's largest metro area recorded a buy-rent gap increase of 82%, rising from 0.38% in 2021 to 119.5% in 2025. Monthly rent payments increased from $1,842 to $2,265, representing a 22.9% increase over the four-year period.
Mortgage payments experienced a more dramatic rise, growing from $2,535 to $4,971, a 96.1% increase that nearly doubled buying costs. Seattle's technology sector growth and limited housing supply contributed to these market pressures.
The area's buy-rent gap reached 119.5% in 2025, indicating that buying became significantly more expensive than renting. The data shows that Seattle joined the ranks of metros where renting became the more financially rational choice for many residents.
The region's combination of high-paying tech jobs and restrictive zoning laws created a perfect storm for housing affordability challenges, particularly affecting potential homebuyers who faced monthly payments nearly $2,700 higher than rental costs.
Oklahoma City, OK Metro Area
Oklahoma City demonstrated one of the most significant market shifts, with its buy-rent gap increasing by 81%. The metro transitioned from a negative gap of -0.31% in 2021, where buying was actually cheaper than renting, to a positive gap of 50.3% in 2025.
Monthly rents rose from $1,118 to $1,379, a 23.4% increase that remained moderate compared to coastal markets. The dramatic change came from mortgage payments, which surged from $775 to $2,073, representing a 167.4% increase.
This transformation eliminated Oklahoma City's previous advantage as an affordable homeownership market. The data reveals that even traditionally affordable markets weren't immune to the national housing crisis.
The city's relatively modest rent increases couldn't offset the massive surge in buying costs, fundamentally altering the housing equation for residents. This shift represents a loss of one of the few remaining markets where buying was more economical than renting.
Denver-Aurora-Lakewood, CO Metro Area
Denver's buy-rent gap increased by 79%, rising from 17% in 2021 to 96.5% in 2025. The metro area maintained relatively moderate rent growth, with monthly costs increasing from $1,679 to $1,927, a 14.8% rise.
However, mortgage payments nearly doubled, jumping from $1,966 to $3,787, representing a 92.6% increase. Denver's appeal as a destination for remote workers and outdoor enthusiasts, combined with limited mountain geography constraining development, contributed to housing pressure.
The data shows Denver crossed the threshold where buying became nearly twice as expensive as renting by 2025. The area's economic diversification and population growth from domestic migration created sustained housing demand.
Denver's transformation from a relatively balanced market in 2021 to one strongly favoring renters illustrates how quickly regional housing markets can shift. The nearly $1,900 monthly difference between buying and renting in 2025 represents a significant financial decision point for residents.
Salt Lake City, UT Metro Area
Salt Lake City recorded a buy-rent gap increase of 70%, moving from 20% in 2021 to 90.4% in 2025. Monthly rent increased from $1,412 to $1,680, a 19.0% rise that remained relatively modest. Mortgage payments experienced a more dramatic surge, rising from $1,695 to $3,197, an 88.6% increase that nearly doubled buying costs.
Utah's growing tech sector, outdoor recreation appeal, and business-friendly environment attracted significant population growth. The data reveals that Salt Lake City's housing market shifted from slight buy-rent equilibrium to a clear rental advantage.
The area's rapid economic development and limited buildable land due to geographical constraints contributed to housing pressure.
By 2025, potential buyers faced monthly costs over $1,500 higher than renters, representing a substantial financial commitment. Salt Lake City's transformation reflects the broader Western U.S. housing crisis, where even secondary markets experienced dramatic affordability challenges that fundamentally altered housing decisions for residents.
Kansas City, MO-KS Metro Area
Kansas City experienced a buy-rent gap increase of 69% points, transforming from a negative gap of -12% in 2021 to a positive gap of 575 in 2025. This shift meant the market moved from slightly favoring homebuying to clearly favoring renting. Monthly rent rose from $1,181 to $1,508, a 27.7% increase that exceeded the national average.
Mortgage payments showed the most dramatic change, surging from $1,039 to $2,367, a remarkable 127.8% increase. Kansas City's traditionally affordable housing market experienced significant disruption during this period.
The data shows that the metro lost its status as a buyer-friendly market, joining the majority of U.S. cities where renting became more economical.
The area's central location, affordable cost of living, and economic diversification attracted new residents, creating housing demand pressure. The transformation eliminated Kansas City's previous advantage for first-time homebuyers, with the monthly difference between buying and renting reaching nearly $900 by 2025.
Memphis, TN-MS-AR Metro Area
Memphis recorded a buy-rent gap increase of 68%, experiencing one of the most dramatic market transformations in the dataset. The metro shifted from a substantial negative gap of -36 in 2021, where buying was significantly cheaper than renting, to a positive gap of 32.8% in 2025.
Monthly rents increased from $1,214 to $1,432, an 18.0% rise that remained moderate. However, mortgage payments experienced explosive growth, rising from $781 to $1,901, a staggering 143.4% increase. Memphis lost its distinction as one of the few major metros where homeownership was substantially more affordable than renting.
The data reveals that this traditionally low-cost market couldn't escape national housing pressures. The area's logistics sector growth and relatively affordable living costs attracted new residents, contributing to housing demand.
By 2025, the monthly difference between buying and renting reached nearly $500, eliminating Memphis's historical advantage for potential homeowners and fundamentally altering housing market dynamics in the Mid-South region.
Dallas-Fort Worth-Arlington, TX Metro Area
The Dallas-Fort Worth metroplex rounded out the top 10 with a buy-rent gap increase of 68%, rising from 5% in 2021 to 73.4% in 2025. Monthly rent increased from $1,462 to $1,758, representing a 20.2% growth rate. Mortgage payments experienced a more dramatic surge, growing from $1,541 to $3,049, a 97.8% increase that nearly doubled buying costs.
The Dallas area's economic diversification, business relocations, and population growth contributed to housing market pressures. The data shows that DFW moved from near-equilibrium between buying and renting to a clear rental advantage. Texas's reputation for affordable housing faced challenges as even this major metro experienced significant affordability pressures.
The area's job growth in technology, finance, and corporate relocations created sustained housing demand. By 2025, potential buyers faced monthly costs over $1,290 higher than renters, representing a significant financial commitment. Dallas-Fort Worth's inclusion in this top 10 list demonstrates how widespread housing affordability challenges became across diverse U.S. markets during this period.
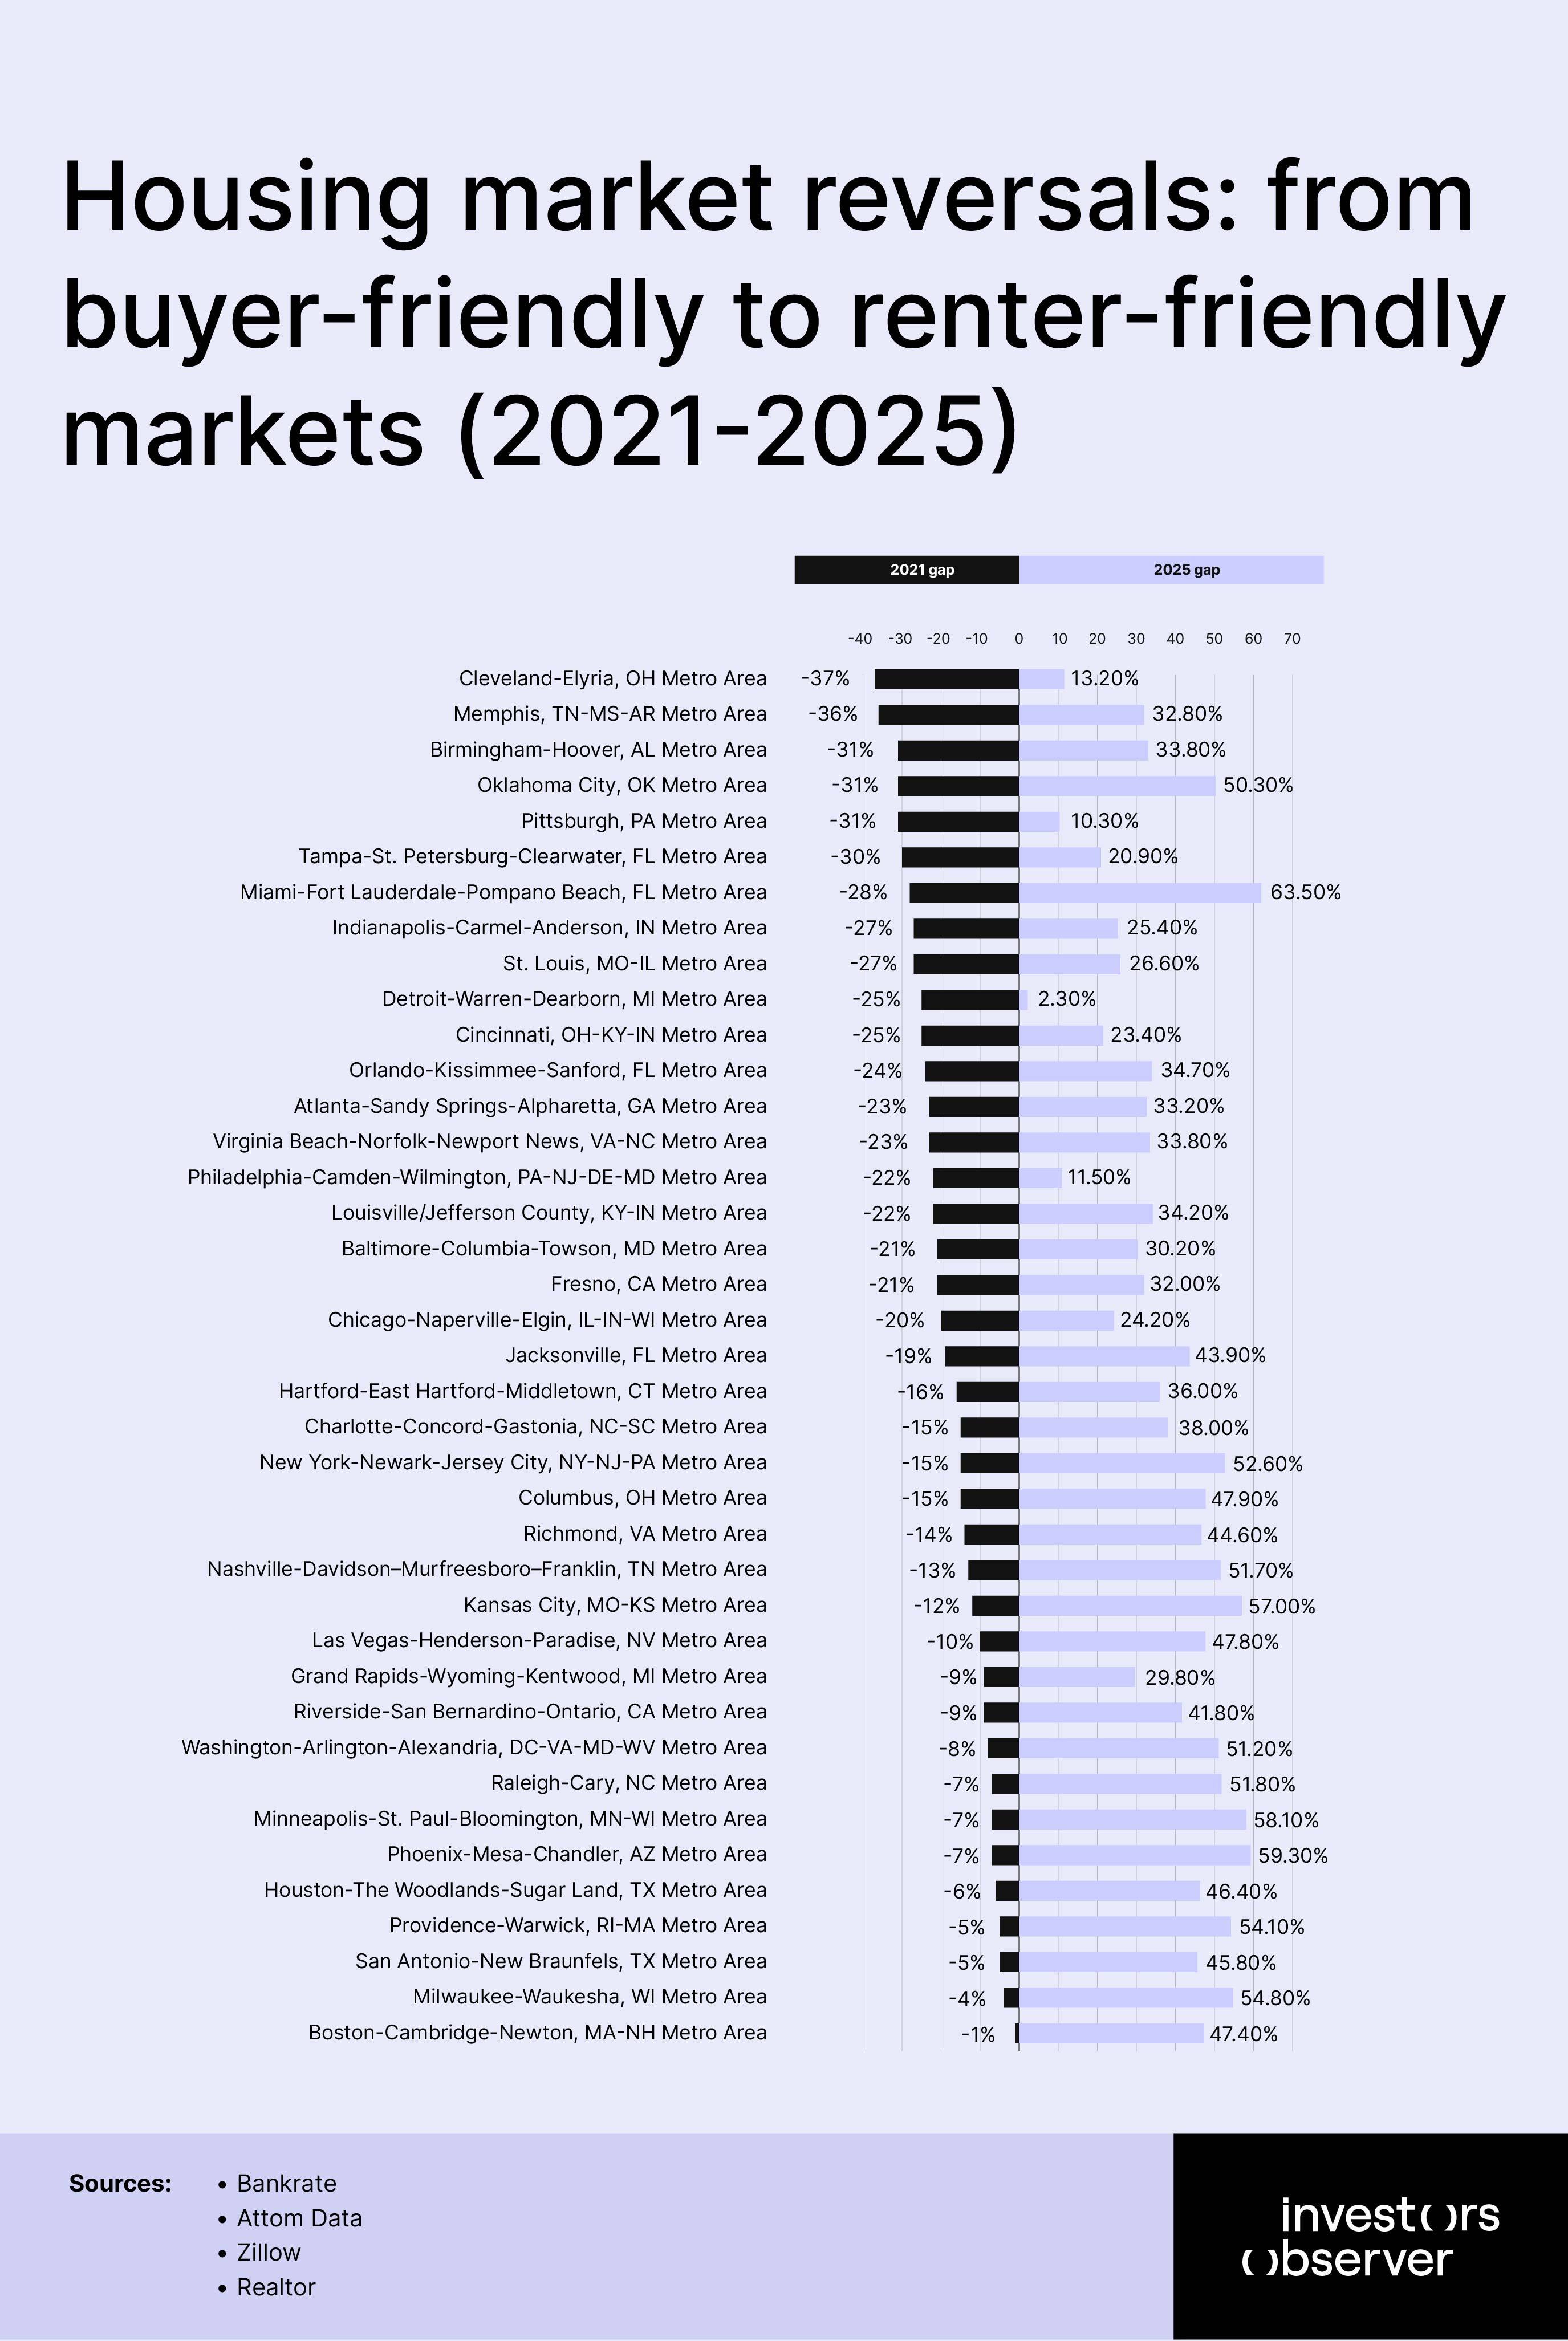
The great flip: metros that shifted from buying advantage to renting advantage
Between 2021 and 2025, 39 of the 50 largest U.S. metropolitan areas completely reversed their housing affordability dynamics, shifting from markets where buying a home was the cheaper option to ones where renting became more economical.
In 2021, these metros had negative buy-rent gaps – meaning that average monthly mortgage payments were below average rents – but by 2025 their gaps turned positive, indicating that mortgage costs had surged past rental costs.
The largest flips occurred in Miami (from –28.4% to +63.5%), Oklahoma City (–30.6% to +50.3%), and Kansas City (–12.0% to +57.0%), driven by mortgage payment increases of 219%, 167%, and 128% respectively, compared to rent increases of 40%, 23%, and 28%.
For residents, this reversal means that the traditional path to homeownership as a path to wealth-building has become prohibitively expensive in many major markets.
Middle-income families in flipped metros now face mortgage payments that are hundreds of dollars higher per month than they would pay in rent, forcing them to delay or abandon plans to buy a first home.
In markets like Miami and New York, prospective buyers who assumed they were on track to transition from renting to owning find themselves locked into perpetual renting or compelled to allocate a much larger share of their income toward a mortgage, eroding savings and increasing financial vulnerability.
This nationwide flip is making wealth inequality worse, locking in homeownership – and the big gains that come with it – for those lucky enough to buy before prices and interest rates soared. Meanwhile, millions of others are stuck paying rent, watching that chance slip away.
Meanwhile, younger generations and new market entrants who rent longer miss out on the home equity accumulation that traditionally underpins middle-class wealth. The flip also constrains geographic mobility, since relocating to pursue job opportunities often comes with a steep increase in housing costs – rent or buy – diminishing the financial incentive to move.
Unless mortgage rates decline substantially or home prices correct, these flipped markets may represent a lasting structural shift in American housing affordability.
How to manage housing affordability in high-flip metros
With markets flipped and renting now a better deal than buying, residents and leaders have to find new ways to keep housing affordable.
First up, potential homebuyers should look into different loan options – like adjustable-rate mortgages with lower starting payments or interest-only loans – to make buying doable without getting stuck with huge bills down the road.
Programs where people share ownership with nonprofits or employers, rent-to-own deals, and community land trusts can also lower upfront costs and monthly payments. In cities where buying has flipped so much, these may be the only realistic ways to buy without breaking the bank.
Renters aren’t powerless either. They can lock in fixed leases to avoid rent hikes and should consider investing money they’d spend on a mortgage into savings or retirement accounts to build wealth over time.
Meanwhile, local governments and employers need to step up by cutting red tape, encouraging affordable housing development, and offering grants or subsidies for workers who need help with down payments.
Working together, these steps can help get housing costs under control and keep the door to homeownership open for more Americans.
Implications for the American dream: new realities, new choices
For working families, young professionals, and retirees, the buy-rent gap means the disruption of the American Dream. When buying was cheaper than renting, it created an on-ramp to wealth-building and housing stability. Now, not only has that ramp vanished, but the chasm is wider than at any other time in recent history.
This research quantifies just how daunting this new reality is. Even the cities least exposed to tech booms or investor activity – middle America, the Sunbelt, the Northeast – are seeing rents become the only rational economic choice for a growing group of residents.
Meanwhile, the legacy of the pandemic housing frenzy and the end of ultra-low rates haunts the market: millions find themselves locked out not just by cash prices, but by monthly payments that make homeownership an aspirational goal only for the affluent or the very lucky.
Moreover, the ever-widening gap raises urgent questions about wealth inequality. Equity gains and the long-term benefits of homeownership are now reserved for those who bought before 2022. New entrants must choose between renting and assuming daunting financial risk.
There’s no precedent for a cycle in which so many families lose the option of buying without radically lowering their living standards, or relying on windfalls.
If mortgage rates stay elevated, and if home prices continue to outpace incomes, it is likely the rent-first logic will persist for years. Policymakers, lenders, and renters should heed the warning in these numbers: without intervention, the American route to homeownership, and the security it promises, may remain blocked for an entire generation.
Methodology
To calculate monthly mortgage payments for 2021, we used Zillow’s median home price data and applied the 30-year fixed mortgage rate, which averaged ~2.96% in that year. We also assumed a 20% down payment and included property tax rate data for each metro area.
For metro areas with missing property tax rate data, we applied the closest available benchmark (sources are listed in the “Sources” section).
The formula used to calculate monthly mortgage payments is:
How Zillow calculates rent prices in metro areas
Zillow uses the Zillow Observed Rent Index (ZORI), which is a smoothed measure of the typical market-rate rent across a given region. ZORI is a repeat-rent index, weighted to the overall rental housing stock to ensure it reflects the entire market – not just homes currently listed for rent.
The index is dollar-denominated by computing the mean of listed rents within the 35th to 65th percentile range for all homes and apartments in a given region. These values are further weighted to represent the composition of the rental housing stock.
We identified markets that completely “flipped” from buyer-friendly to renter-friendly between April 2021 and 2025 by applying two filters within the data:
- 2021 Buy–Rent Gap < 0: In 2021, the gap was negative, meaning buying was more economical than renting.
- 2025 Buy–Rent Gap > 0: In 2025, the gap turned positive, meaning renting became more economical than buying.
Sources
- Bankrate
- Attom Data
- Zillow
Realtor
Your email address will not be published. Required fields are markedmarked