Ranked: the U.S. states most and least exposed to China import tariffs
As tariffs on Chinese imports reach historic highs, new data reveals which U.S. states are most exposed and what that could mean for their economies.
States like California and Nevada, where up to a quarter of all imports come from China, are particularly vulnerable. These states are home to some of the nation’s largest retailers, logistics companies, and manufacturers, all of which rely heavily on goods flowing in from Chinese suppliers.
As higher tariffs ripple through supply chains, the effects are likely to be widespread, from rising consumer prices to potential slowdowns in local economies, touching businesses, workers, and families.
Key findings
- California is the top state for Chinese imports based on imports from China in USD, bringing in $122.75 billion in 2024, which is 25% of its total imports and 12% of its state GDP.
- Nevada has the highest reliance on Chinese imports as a percentage of total imports (26%), with $4.89 billion in goods from China, heavily concentrated in electronics and minerals.
- Tennessee has the highest GDP exposure. Its imports from China account for 22% of its state GDP, the largest GDP share among the top ten, highlighting significant economic sensitivity to trade disruptions.
- The top ten states account for the majority. The ten most reliant states by import value collectively account for the vast majority of all U.S. imports from China, with each importing over $12.8 billion in 2024.
- Least reliant states are small and rural: Montana, Alaska, and Wyoming are the least reliant, each importing $132 million or less from China.
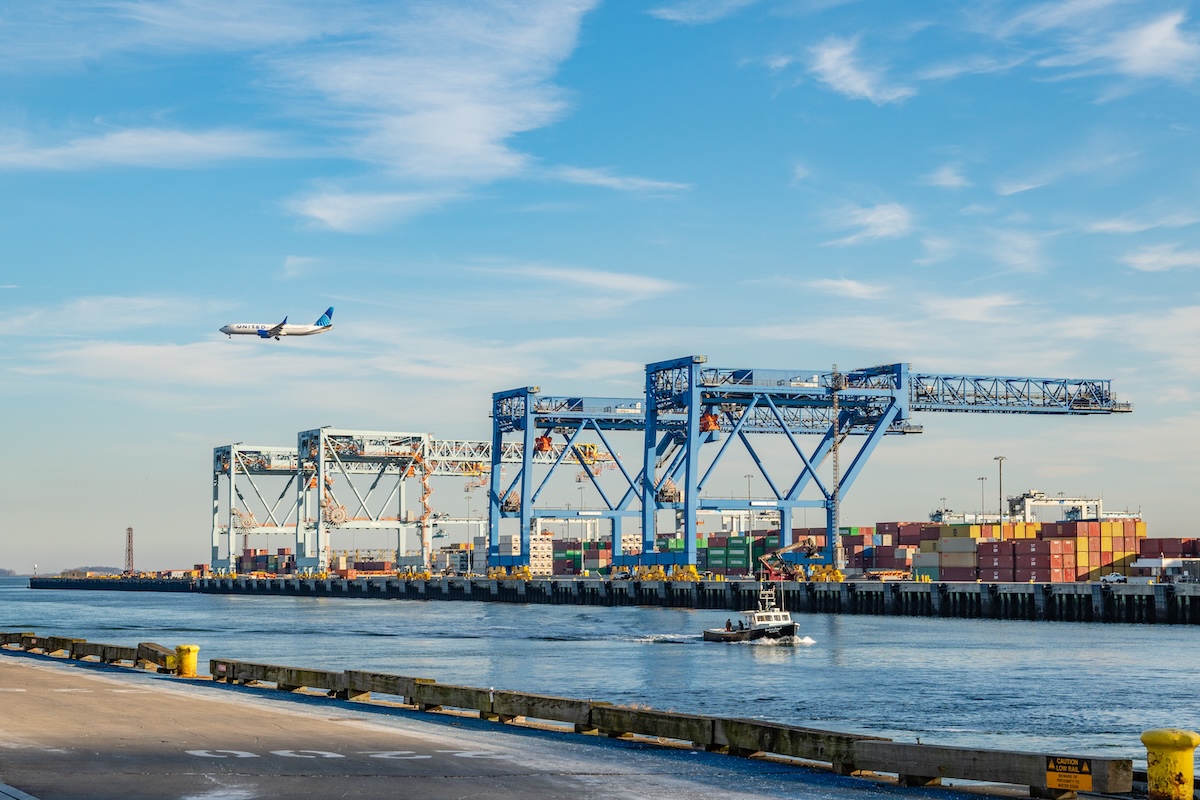
- Tariff risks are concentrated. States with major ports or manufacturing sectors (California, Illinois, Texas, Tennessee) are most exposed to the impact of higher tariffs or supply chain shocks due to their high import volumes and economic dependence on Chinese goods.
The 10 most China-import-reliant states
Here are the states where imports from China make up the largest share of GDP:
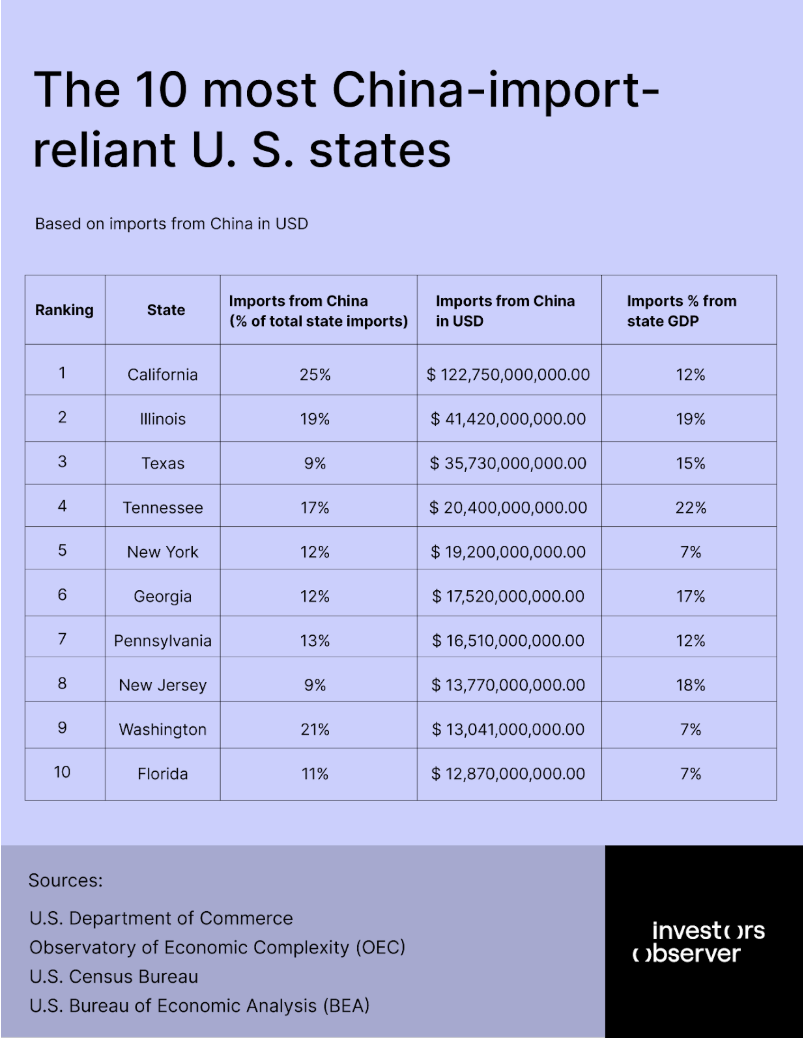
California leads the nation in trade with China, recording $122.75 billion in imports from the country in 2024. This figure represents 25% of California’s total imports, highlighting the state’s deep economic ties to Chinese manufacturing and supply chains. In a broader context, these imports account for nearly 12% of California’s overall GDP, underlining how critical international trade, and particularly trade with China, is to the state’s economic engine.
Illinois, which primarily trades with Canada, imported $218 billion worth of goods overall, with 19% – or $41.42 billion – sourced from China. Imports account for an even bigger slice of Illinois' economy at 19% of GDP, showing how states with smaller overall trade volumes can still be highly trade-dependent relative to their economic size.
Texas brought in $35.73 billion in Chinese goods in 2024, which is 9% of its total imports and 15% of its GDP. While Mexico is Texas’s top trade partner, China’s role is crucial in supplying electronics and industrial equipment for the state’s booming energy and technology sectors, making it vulnerable to price shocks and supply delays from tariff changes.
Tennessee imported $20.4 billion from China in 2024, representing 17% of its total imports and an outsized 22% of its GDP. The state’s high dependency ratio is driven by electronics and auto parts manufacturing, meaning any supply chain disruption from China would have a pronounced impact on local industry and jobs.
New York’s $19.2 billion in Chinese imports in 2024 accounts for 12% of its imports and 7% of its GDP. The state’s diverse economy, spanning finance, retail, and manufacturing, relies on Chinese goods for both consumer markets and industrial needs, exposing it to broad economic risks from tariffs or trade slowdowns.
Georgia imported $17.52 billion from China in 2024, making up 12% of its imports and 17% of its GDP. The state’s logistics and distribution sectors, anchored by Atlanta and Savannah, depend on steady flows of Chinese electronics and consumer goods, supporting thousands of jobs vulnerable to trade friction.
Pennsylvania’s $16.51 billion in Chinese imports in 2024 equals 13% of state imports and 12% of its GDP. The state’s manufacturing and metals sectors are especially reliant on Chinese machinery and raw materials, so higher tariffs could increase costs and slow growth in its industrial regions.
New Jersey imported $13.77 billion from China in 2024, representing 9% of its imports and 18% of its GDP. As a major East Coast port state, New Jersey’s economy is tightly linked to Chinese electronics and household goods, with logistics and retail sectors directly exposed to any import disruptions.
Washington received $13.04 billion in Chinese imports in 2024, accounting for 21% of its imports and 7% of its GDP. The state’s aerospace and rare earth mineral industries are highly dependent on Chinese supply chains. It could take 5–10 years for domestic alternatives to be established if trade tensions persist.
Florida imported $12.87 billion from China in 2024, 11% of its imports and 7% of its GDP. The state’s consumer-driven economy relies on Chinese electronics, apparel, and household goods, so tariffs would likely raise prices for consumers and disrupt Florida’s large logistics sector.
While some states didn’t rank among the top ten by total imports in USD, they still show significant reliance when measured by the share of imports coming from China. For instance, Nevada leads in this metric, with 26% of its total imports originating from China.
The 10 least China-import-reliant states
Some states, largely in rural West, import relatively little from China.
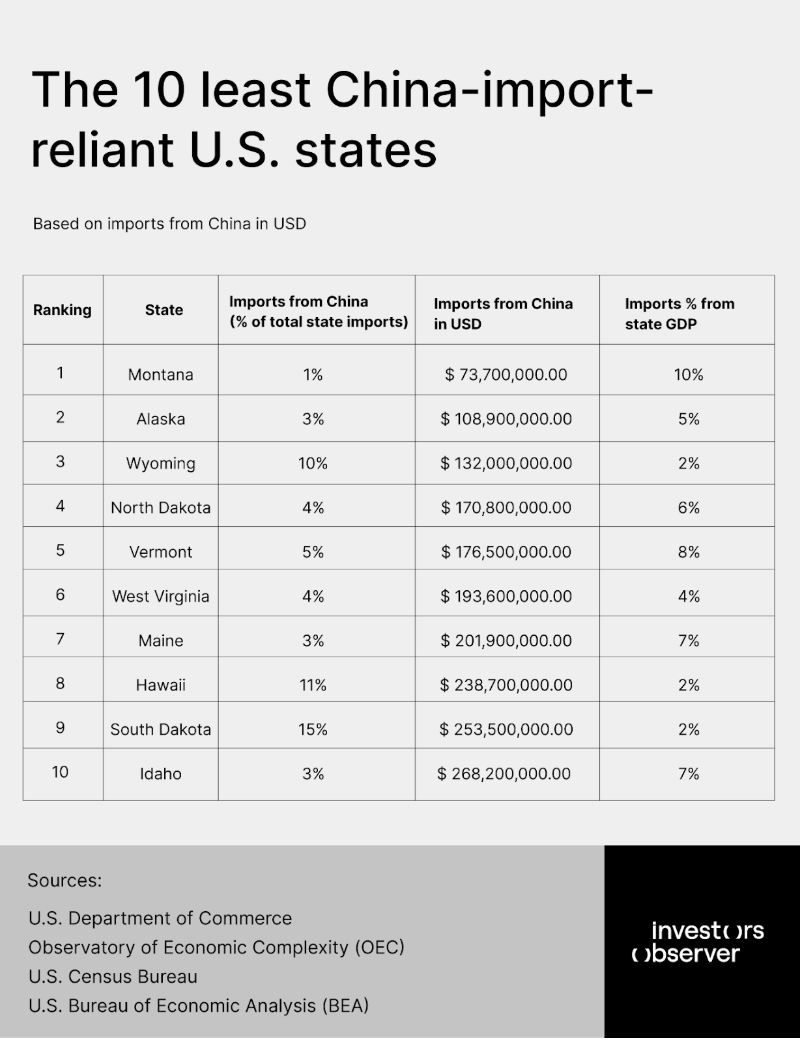
Montana, Alaska, and Wyoming are the three least reliant states on Chinese imports. Montana stands out with only 1% of its imports coming from China-just $73.7 million in 2024, thanks to its heavy focus on agriculture, energy, and natural resources, and its strong trade relationship with neighboring Canada.
Alaska imported just $108.9 million in goods from China in 2024, representing 3% of its total imports. The state’s trade profile is unique: while it has a trade surplus with China due to substantial seafood exports, its import needs are minimal and mainly fulfilled by South Korea and Canada, insulating its economy from tariff shocks.
Wyoming’s imports from China totaled only $132 million in 2024, accounting for 2% of state GDP and just 10% of its total imports. With an economy centered on minerals and energy, and Canada as its main trading partner, Wyoming’s exposure to Chinese tariffs is negligible, making it one of the most insulated states from U.S.–China trade tensions.
Implications for Americans
Consumers across the country may experience rising prices and fewer choices at major retailers as tariffs on Chinese imports increase costs for businesses.
Leading chains like Walmart, Amazon, and Target, which depend heavily on products from China, are already warning that shoppers could see higher prices and possible shortages on store shelves.
This could make everyday goods-especially electronics, clothing, and home items-more expensive and harder to find.
Supply chain disruptions are expected to hit these categories the hardest, affecting both large retail stores and online shopping platforms.
While some companies might try to absorb part of the extra costs, many will need to pass them on to consumers, potentially fueling inflation and making it more difficult for families to stretch their budgets. If shoppers cut back on spending due to higher prices, it could also slow sales for retailers and impact local economies.
States that rely most on Chinese imports, such as California and Nevada, may feel these effects more intensely, with local businesses and workers facing greater uncertainty.
As companies adjust by seeking new suppliers or changing their product offerings, the retail environment could shift, leading to changes in product availability and pricing for communities nationwide.
Methodology and sources
InvestorsObserver analyzed 2024 state level trade data from the U.S. Census Bureau, Bureau of Economic Analysis, Trade.gov, state commerce reports, and industry news.
The following data were used:
- Total Imports by State (in USD)
- State GDP (in USD)
- Share of GDP from Imports (%)
- Imports from China (in USD)
- Share of Imports from China (%)
To calculate imports from China in USD, we multiplied imports (2024) in USD and Imports from China %.
All figures reflect the most recent data available as of 2024.