Halloween prices outpacing income growth – a researcher’s look at 25 years of inflation
Halloween is more than just costumes and candy – it’s also a snapshot of inflation’s real impact on everyday Americans. Using data from 2000 through 2025, this InvestorsObserver’s report breaks down consumer price indexes and inflation, focusing on what you pay for pumpkins, candy, and decorating your home.
The researchers asked a question: as wages try to keep pace, are you really getting more for your money? The patterns revealed here highlight periods of fast price rises and relative calm, giving insight into how economic factors impact America's favorite autumn holiday.
Key findings
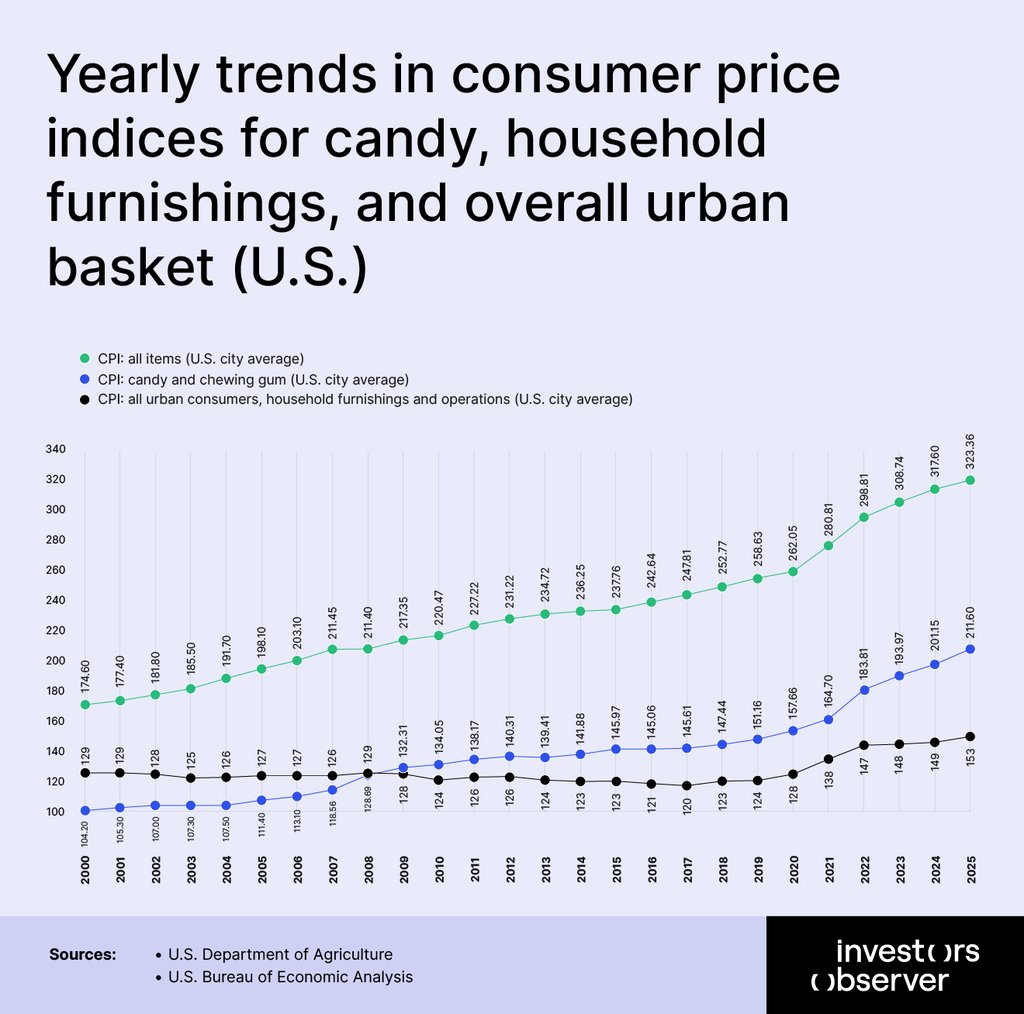
- The overall Consumer Price Index (CPI) in the U.S. rose by approximately 36% over the same 2015–2025 period, with an average annual increase of 2.5%.
- Wholesale pumpkin prices have risen about 67% from 2015 to 2025, with roughly 4% average annual growth.
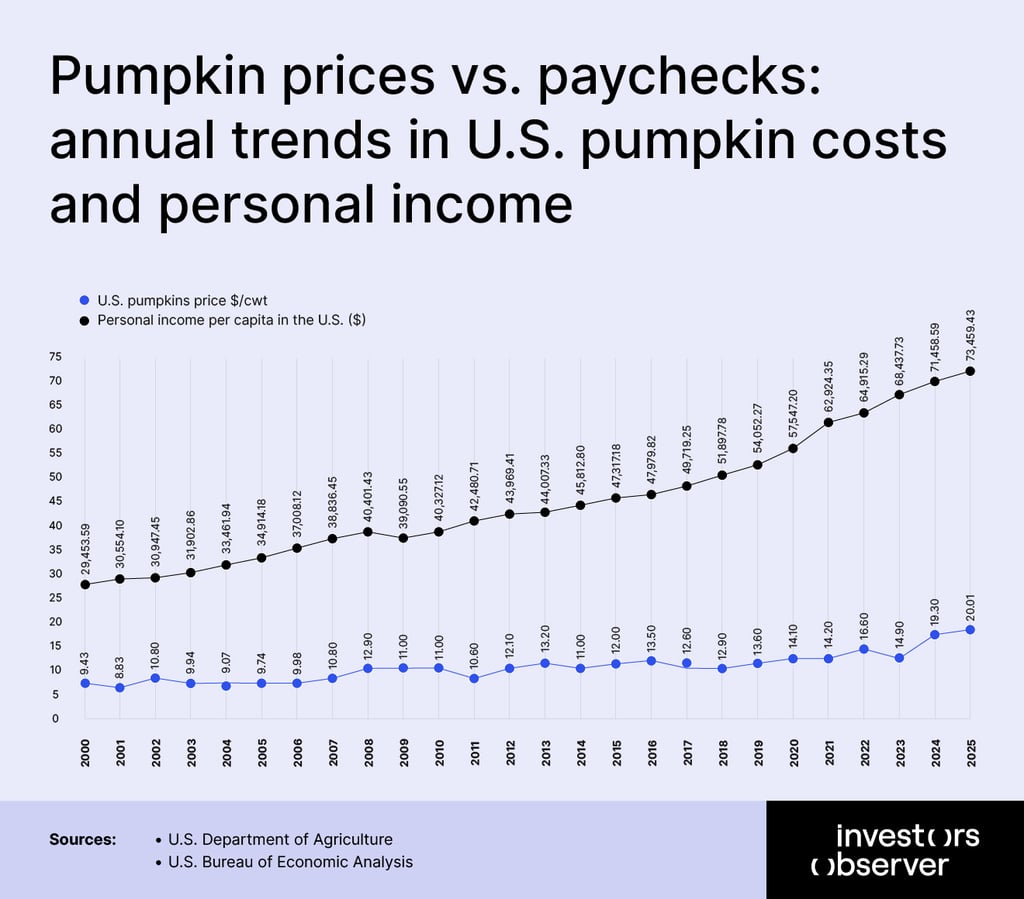
- Historically, pumpkin prices peaked during 2008 (12.9 USD per cwt) and then again in 2024 – 2025, reaching 19.3 – 20.0 USD per cwt.
- The Candy and Chewing Gum CPI Index increased by 45% between 2015 and 2025, reflecting a consistent YoY growth rate averaging 2.9%.
- U.S. per capita personal income rose by 56% from 2015 to 2025, growing on average 3.7% per year.
- This income growth slightly outpaced CPI, aligning with the increase in Halloween spending, which implies flat purchasing power rather than real improvement.
The 2000s: stability with gradual inflation
The decade was marked by economic volatility. Beginning in 2000 with per capita income at $29,453, Americans saw modest but steady growth until the economic crisis hit in 2008.
While the CPI showed consistent annual increases averaging 2.5% throughout the decade, personal income growth was erratic, reaching 6% in 2006 before dropping to -3% in 2009 during the Great Recession.
Pumpkin prices tell an interesting economic story of the 2000s. Starting at $9.43 per hundredweight in 2000, prices fluctuated significantly, displaying the decade's economic instability:
- They dropped 6% in 2001 following the dot-com bubble burst
- Jumped 22% in 2002 during economic recovery
- Peaked at $12.90 in 2008 (a 19% annual increase)
- Fell 15% in 2009 as recession reduced consumer spending
The candy and chewing gum CPI reveals changing consumer priorities during economic hardship. While the overall economy struggled in 2008-2009, candy prices increased by 8.5% in 2008 and another 2.8% in 2009, suggesting that affordable indulgences remained important to consumers even during financial strain.
The household furnishings and operations index reflects consumer confidence in making larger purchases. This category showed minimal growth (averaging just 0.7% annually) and even declined during several years (-1.5% in 2002, -1.8% in 2003, -1.1% in 2009), indicating cautious consumer spending on non-essentials throughout the decade.
The 2008-2009 period shows how economic shock affected various sectors differently:
- Pumpkin prices: +19% in 2008, -15% in 2009
- Candy CPI: +8.5% in 2008, +2.8% in 2009
- Household items: +2.0% in 2008, -1.1% in 2009
- Personal income: +4% in 2008, -3% in 2009
This pattern shows how quickly luxury and discretionary purchases were affected when incomes contracted, while more modest treats like candy maintained demand.
Despite economic turbulence, Halloween spending remained relatively resilient. The steady increases in candy prices (even during recession years) suggest that seasonal celebrations remained a priority for Americans throughout the decade.
The 2000s showed that economic indicators like pumpkin prices and candy costs can reflect broader economic trends while highlighting how consumers prioritize spending during periods of both growth and contraction. From boom to bust, America's Halloween traditions persisted, adapting to the economic realities of a transformative decade.
The 2010s: rising costs and inflationary pressures
The 2010s began in the shadow of the Great Recession but evolved into a decade of consistent economic expansion. Starting with per capita income at $40,327 in 2010, Americans experienced steady income growth averaging 3.5% annually through 2019, reaching $54,052 by decade's end – an impressive 34% cumulative increase.
Unlike the volatility of the 2000s, the 2010s featured no negative income growth years, reflecting a stable economic recovery.
Pumpkin prices tell a story of agricultural market fluctuations throughout the decade:
- Starting at $11.00 per hundredweight in 2010
- Experiencing significant volatility: dropping 4% in 2011, rising 14% in 2012
- Reaching a decade peak of $13.60 in 2019 (23.6% higher than 2010)
- Showing remarkable year-to-year instability despite overall economic stability
For shoppers, this meant facing unpredictable Halloween expenses – one year finding pumpkins surprisingly affordable (a welcome break in 2011), then feeling sticker shock the very next season with a 14% price jump.
All of this culminating in significantly pricier jack-o'-lanterns by 2019 that cost nearly a quarter more than at the decade's start, forcing families to regularly adjust their seasonal budgets despite the supposedly stable economy.
The candy and chewing gum CPI component reflects evolving consumer spending on seasonal indulgences. Starting at 134.05 in 2010, it grew moderately through the decade with two unusual negative years (-0.6% in 2013 and -0.6% in 2016), before accelerating to 157.66 by 2020 – a 17.6% total increase.
This relatively modest growth suggests candy manufacturers absorbed some input costs to maintain competitive pricing during the recovery period.
The household furnishings index reveals shifting consumer confidence in making larger purchases. This category showed minimal growth early in the decade and even declined in several years (-1.4% in 2013, -0.9% in 2014, -1.1% in 2016), before strengthening in the decade's final years. This pattern reflects cautious consumer spending on non-essentials during the early recovery followed by increased confidence later in the decade.
Overall inflation remained remarkably tame during the 2010s. The CPI advanced from 220.47 in 2010 to 262.05 in 2020 – an increase of just 18.9% over the entire decade (averaging under 2% annually).
With personal incomes rising 42.7% during the same period, Americans generally experienced increased purchasing power, allowing for greater discretionary spending on seasonal celebrations like Halloween.
The 2010s represented a period of economic healing and gradual prosperity that transformed Halloween from a modest seasonal celebration into a major consumer spending event, reflecting Americans' growing economic confidence and willingness to invest in seasonal festivities as their financial security increased.
The early 2020s: inflation peaks and spending expands
The early 2020s have been defined by extreme economic volatility. Beginning with the COVID-19 pandemic's onset, per capita income paradoxically surged from $57,547 in 2020 to $62,924 in 2021 – a remarkable 9% single-year increase driven largely by government stimulus measures.
This upward trajectory continued, reaching $73,459 by 2025, representing a substantial 27.7% cumulative increase in just five years, and significantly outpacing the previous decade's growth rate.
Pumpkin prices reveal the inflation story of the early 2020s with dramatic clarity:
- Starting at $14.10 per hundredweight in 2020
- Rising modestly to $14.20 in 2021 amid initial pandemic disruptions
- Surging 17% to $16.60 in 2022 as inflation took hold
- Briefly retreating to $14.90 in 2023 (-10%) before skyrocketing to $19.30 in 2024 (30%)
- Reaching $20.01 by 2025, a steep 42% increase from 2020
The candy and chewing gum CPI component reflects the inflation surge that defined the early 2020s. Starting at 157.66 in 2020, it experienced significant annual increases:
- 4.5% in 2021 as supply chains strained
- A dramatic 11.6% surge in 2022 during peak inflation
- Moderating to 5.5% in 2023 and 3.7% in 2024, but still elevated
- Reaching 211.60 by 2025, representing a 34% five-year increase
This substantial price growth far outpaced the previous decade's candy inflation rate, reflecting significant input cost increases and pricing power in the confectionery sector.
The household furnishings index reveals the widespread nature of inflation across consumer categories. After minimal growth in the 2010s, this sector experienced:
- A notable 3.2% rise in 2020 as pandemic home investments increased
- Dramatic increases of 7.4% in 2021 and 6.8% in 2022 amid supply chain disruptions
- Moderating to more sustainable levels by 2025
Overall CPI growth followed a similar pattern, with the most dramatic increases (7.2% in 2021, 6.4% in 2022) representing the highest inflation rates in four decades.
While nominal incomes increased substantially (55% from 2015 to 2025), the data suggests these gains have been largely offset by inflation. Both income and the cost of a typical Halloween grocery basket have grown by roughly the same percentage since 2015. This indicates that despite significant wage growth, Americans' actual purchasing power has remained relatively stable.
The early 2020s show how extraordinary economic circumstances (pandemic disruption, massive government stimulus, supply chain breakdowns, and resulting inflation) have transformed economic patterns while reinforcing Halloween's cultural and economic significance.
Despite financial challenges, Americans continue prioritizing seasonal celebrations, making Halloween an increasingly important economic indicator in uncertain economic times.
How many Halloween pumpkins can you buy?
Despite fluctuations, the long-term trend shows a gradual decline in pumpkin affordability. In other words, despite decades of economic growth and rising incomes, Americans' purchasing power for seasonal traditions is diminishing.
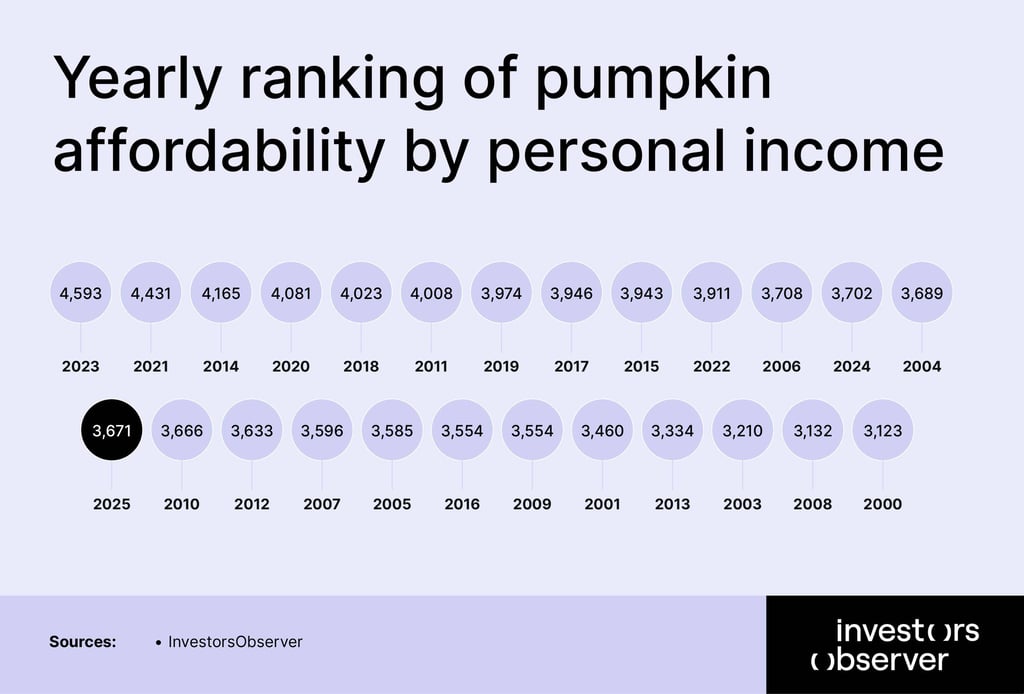
Over these 25 years, the number of pumpkins purchasable with a full year’s personal income generally ranged between approximately 3,100 to over 4,593 pumpkins. There has been a 67% rise in wholesale pumpkin prices since 2015, with an average annual growth of approximately 4%.
In the year 2000, wholesale pumpkins cost about $9.43 per 100 pounds. Given that average personal income was near $29,453, one could theoretically purchase 3123 pounds of pumpkins with that income.
Fast forward to 2025, pumpkin prices have more than doubled – reaching around $20 per 100 pounds, while the average annual income reached about $73,459. Although income nearly doubled, it did not keep pace proportionally with pumpkin prices.
This means consumers’ pumpkin purchasing power has not significantly improved because income growth is mainly offsetting inflation in these prices.
The peak purchasing power occurred around recent years, for example in 2023 when it reached about 4,593 pumpkins, indicating relatively higher affordability then. However, the trend shows some volatility and dips in certain years, reflecting the combined effects of pumpkin price inflation, consumer price inflation, and income changes. This implies that consumers feel the pinch from rising prices despite earning more.
For consumers, this means budgeting for Halloween and pumpkin-related festivities may require more careful financial planning in coming years, as the rising costs are unlikely to be offset by proportional wage increases.
Methodology and sources
U.S. pumpkin price data from 2000 to 2024 was collected from the U.S. Department of Agriculture (USDA). It shows wholesale prices in the U.S., expressed in dollars per 1 cwt (100 pounds).
The data for candy and chewing gum prices relative to the CPI index was sourced from Federal Reserve Bank of St. Louis.
For better context and comparison, we also included the average income increase by state in the U.S. from 2015 to 2025, using data from the U.S. Bureau of Economic Analysis (BEA).
For 2025, we assumed that the U.S. per capita income will increase by approximately 3%, based on data from Trading Economics and the Bureau of Economic Analysis.