Dry January math: How long it really takes to save $1,000 going sober on nights out in major U.S. cities
Dry January promises big savings for skipping alcohol. But there’s a catch nobody talks about: for social drinkers still hitting the bars, you’ll spend almost the same on non-alcoholic drinks.
InvestorsObserver analyzed prices at more than 100 bars across 15 major U.S. metros and found that going sober on a night out saves just $6 on average – based on the difference between an alcoholic basket (3 beers + 1 cocktail) and its non-alcoholic equivalent.
But location determines whether sobriety actually pays off. Nightly savings range from $1.40 in Atlanta to $10.30 in Los Angeles. That gap means saving $1,000 takes 2 years in Los Angeles versus 15 years in Atlanta.
Key findings
- Dry January saves just $6 per night out – average across 15 major U.S. metros.
- Top savings cities: Los Angeles ($10.30), Seattle ($9.90), Houston ($8.90).
- Worst savings: Atlanta ($1.40), Tampa ($2.95), Phoenix ($5.30).
- Los Angeles residents hit $1,000 in sober bar savings fastest – in just 2 years.
- Atlanta residents take longest to save $1,000 on non-alcoholic nights out – 15 years.
Top 5 metros for highest per-night Dry January bar savings when switching from alcoholic to non-alcoholic drinks
The financial benefit of skipping alcohol at bars and restaurants isn’t the same everywhere.
Across America’s 15 largest cities, the money people save by choosing non-alcoholic drinks on a night out ranges from practically zero to over $10.
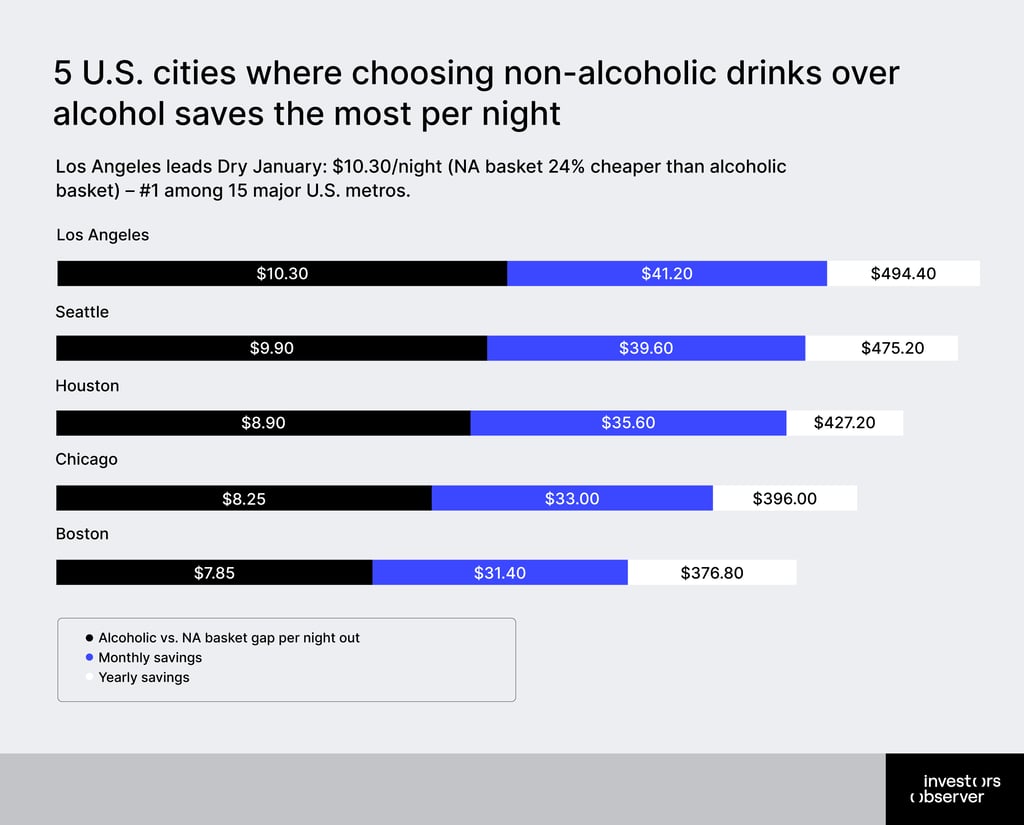
“In Los Angeles, Dry January can save you $494 a year. In Atlanta, it’s just $67. The same sobriety commitment yields very different financial outcomes by zip code, challenging claims of universal wallet benefits,” explained Sam Bourgi, senior analyst at InvestorsObserver.
Los Angeles
Los Angeles residents save $10.30 per night by switching from alcoholic to non-alcoholic beverages at bars – the highest among 15 major U.S. metros. The alcoholic basket (3 beers + 1 cocktail) totals $42.80, while the NA equivalent costs $32.50.
California’s average alcohol expenditure is $1,001.37 per adult annually. Local bar prices average $8.80 for beer, $16.40 for middle-grade cocktails, $13.60 for wine glasses, $7.80 for NA beer, and $9.10 for mocktails.
Four bar outings per month switching to NA drinks can lead to $41.20 monthly or $494.40 annually.
Seattle
Seattle residents save $9.90 per night by switching from alcoholic to non-alcoholic beverages at bars – the second highest among 15 major U.S. metros. The alcoholic basket (3 beers + 1 cocktail) totals $40.90, while the NA equivalent costs $31.00.
Washington’s average alcohol expenditure is $1,070.99 per adult annually – the highest statewide figure analyzed. Local bar prices average $8.60 for beer, $15.10 for middle-grade cocktails, $11.30 for wine glasses, $6.40 for N/A beer, and $11.80 for mocktails.
Four bar outings per month switching to NA drinks can save $39.60 monthly or $475.20 annually.
Houston
Houston residents save $8.90 per night by switching from alcoholic to non-alcoholic beverages at bars – the third highest among 15 major U.S. metros. The alcoholic basket (3 beers + 1 cocktail) totals $36.40, while the N/A equivalent costs $27.50.
Texas’s average alcohol expenditure is $972.04 per adult annually. Local bar prices average $7.80 for beer, $13.00 for middle-grade cocktails, $9.67 for wine glasses, $6.10 for NA beer, and $9.20 for mocktails.
Four bar outings per month switching to NA drinks can save $35.60 monthly or $427.20 annually.
Chicago
Chicago residents save $8.25 per night by switching from alcoholic to non-alcoholic beverages at bars – the fourth highest among 15 major U.S. metros. The alcoholic basket (3 beers + 1 cocktail) totals $36.85, while the NA equivalent costs $28.60.
Illinois’s average alcohol expenditure is $774.28 per adult annually. Local bar prices average $8.20 for beer, $12.25 for middle-grade cocktails, $10.40 for wine glasses, $5.80 for NA beer, and $11.20 for mocktails.
Four bar outings per month switching to NA drinks can save $33.00 monthly or $396.00 annually.
Boston
Boston residents save $7.85 per night by switching from alcoholic to non-alcoholic beverages at bars – the fifth highest among 15 major U.S. metros. The alcoholic basket (3 beers + 1 cocktail) totals $37.95, while the N/A equivalent costs $30.10.
Massachusetts’s average alcohol expenditure is $1,185.54 per adult annually – the highest statewide. Local bar prices average $7.45 for beer, $15.60 for middle-grade cocktails, $12.30 for wine glasses, $6.70 for N/A beer, and $10.00 for mocktails.
Four bar outings per month switching to NA drinks can save $31.40 monthly or $376.80 annually.
Dry January’s middle ground: save up to $360/year in these 5 cities – if you actually go out
These five metros – Miami, Minneapolis, San Francisco, Philadelphia, and Dallas-Fort Worth – deliver respectable but not significant Dry January returns.
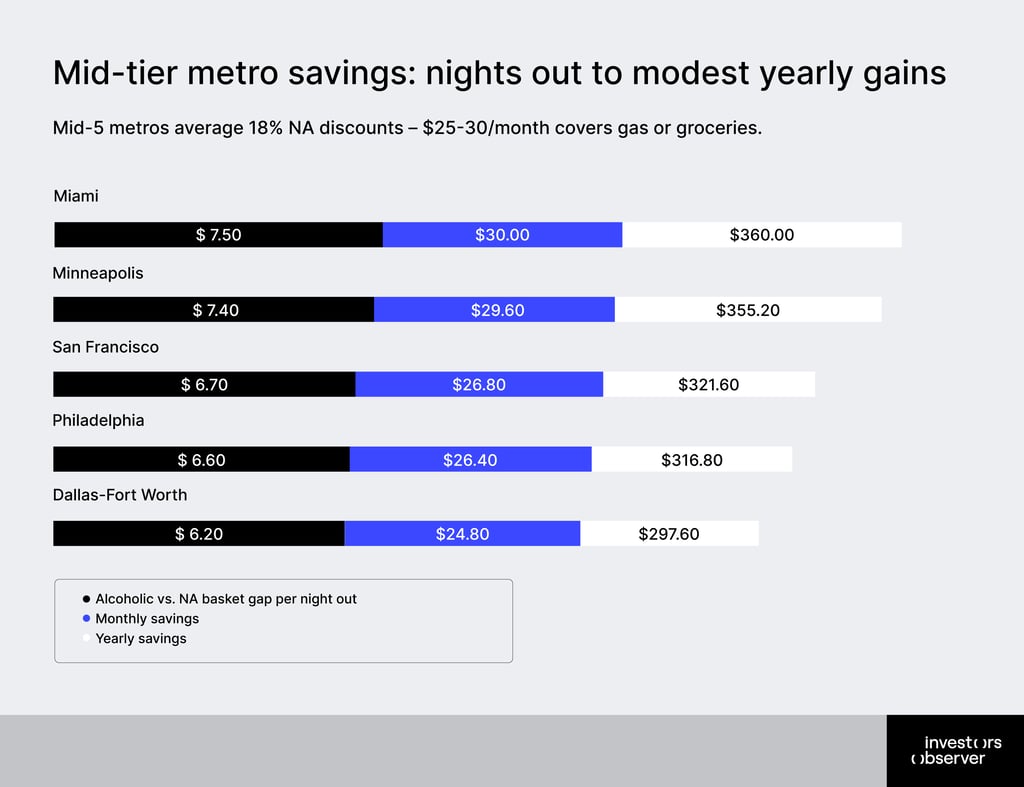
“For regular nightlife-goers, $25-30 monthly adds up without transforming budgets – enough for a gym membership or streaming service, but far from the “life-changing” savings Dry January marketing promises,” said Bourgi.
Miami
Miami residents save $7.50 per night by switching from alcoholic to non-alcoholic beverages at bars – the sixth highest among 15 major U.S. metros. The alcoholic basket (3 beers + 1 cocktail) totals $41.70, while the N/A equivalent costs $34.20.
Florida’s average alcohol expenditure is $959.37 per adult annually. Local bar prices average $8.90 for beer, $15.00 for middle-grade cocktails, $12.80 for wine glasses, $7.40 for N/A beer, and $12.00 for mocktails.
Four bar outings per month switching to NA drinks can save $30.00 monthly or $360.00 annually.
Minneapolis
Minneapolis residents save $7.40 per night by switching from alcoholic to non-alcoholic beverages at bars – the seventh highest among 15 major U.S. metros. The alcoholic basket (3 beers + 1 cocktail) totals $35.40, while the NA equivalent costs $28.00.
Minnesota’s average alcohol expenditure is $954.14 per adult annually. Local bar prices average $7.20 for beer, $13.80 for middle-grade cocktails, $11.60 for wine glasses, $6.80 for NA beer, and $7.60 for mocktails.
Four bar outings per month switching to NA drinks yield $29.60 monthly or $355.20 annually.
San Francisco
San Francisco residents save $6.70 per night by switching from alcoholic to non-alcoholic beverages at bars – the eighth highest among 15 major U.S. metros. The alcoholic basket (3 beers + 1 cocktail) totals $42.00, while the NA equivalent costs $35.30.
California’s average alcohol expenditure is $1,001.37 per adult annually. Local bar prices average $8.50 for beer, $16.50 for middle-grade cocktails, $13.70 for wine glasses, $7.70 for N/A beer, and $12.20 for mocktails.
Four bar outings per month switching to NA drinks can save $26.80 monthly or $321.60 annually.
Philadelphia
Philadelphia residents save $6.60 per night by switching from alcoholic to non-alcoholic beverages at bars – the ninth highest among 15 major U.S. metros. The alcoholic basket (3 beers + 1 cocktail) totals $37.90, while the NA equivalent costs $31.30.
Pennsylvania’s average alcohol expenditure is $780.53 per adult annually. Local bar prices average $7.90 for beer, $14.20 for middle-grade cocktails, $13.00 for wine glasses, $7.10 for NA beer, and $10.00 for mocktails.
Four bar outings per month switching to NA drinks can save $26.40 monthly or $316.80 annually.
Dallas-Fort Worth
Dallas-Fort Worth residents save $6.20 per night by switching from alcoholic to non-alcoholic beverages at bars – the tenth highest among 15 major U.S. metros. The alcoholic basket (3 beers + 1 cocktail) totals $34.10, while the NA equivalent costs $27.90.
Texas’s average alcohol expenditure is $972.04 per adult annually. Local bar prices average $6.90 for beer, $13.40 for middle-grade cocktails, $13.00 for wine glasses, $6.10 for NA beer, and $9.60 for mocktails.
Four bar outings per month switching to NA drinks can save $24.80 monthly or $297.60 annually.
Bottom 5 metros: where switching to sober drinks barely saves a dollar
People might think the most expensive cities would give the biggest Dry January payouts but the data shows that it isn’t the case. New York City, Detroit, Phoenix, Tampa, and Atlanta deliver the smallest savings which range from Atlanta’s $1.40 per night to New York’s $5.80.

“Location kills Dry January’s universal savings promise. Atlanta’s $1.40 nightly non-alcoholic beverage discount equals $67 yearly – your coffee budget. Tampa is better ($142 annually) but still lags leaders like Los Angeles’s $494. Bars pricing mocktails near alcohol prices erase financial motivation in quite a few cities,” said Bourgi.
New York City
New York City residents save $5.80 per night by switching from alcoholic to non-alcoholic beverages at bars – the 11th highest among 15 major U.S. metros. The alcoholic basket (3 beers + 1 cocktail) totals $44.10, while the NA equivalent costs $38.30.
New York state’s average alcohol expenditure is $1,024 per adult annually. Local bar prices average $8.20 for beer, $17.50 for middle-grade cocktails, $18.40 for wine glasses, $7.40 for NA beer, and $13.90 for mocktails.
Four bar outings per month switching to NA drinks can save $23.20 monthly or $278.40 annually.
Detroit
Detroit residents save $5.40 per night by switching from alcoholic to non-alcoholic beverages at bars – ranking 12th among 15 major U.S. metros. The alcoholic basket (3 beers + 1 cocktail) totals around $30.00, while the NA equivalent costs around $23.57.
Michigan’s average alcohol expenditure is around $900 per adult annually. Local bar prices average $6.00 for beer, $12.50 for middle-grade cocktails, $12.80 for wine glasses, $5.60 for NA beer, and $9.10 for mocktails.
Four bar outings per month switching to NA drinks can save $25.72 monthly or $308.64 annually.
Phoenix
Phoenix residents save $8.20 per night by switching from alcoholic to non-alcoholic beverages at bars – ranking 13th among 15 major U.S. metros. The alcoholic basket (3 beers + 1 cocktail) totals $35.50, while the NA equivalent costs $27.30.
Arizona’s average alcohol expenditure is $986 per adult annually. Local bar prices average $7.10 for beer, $14.20 for middle-grade cocktails, $14.20 for wine glasses, $6.40 for NA beer, and $10.60 for mocktails.
Four bar outings per month switching to NA drinks can save $32.80 monthly or $393.60 annually.
Tampa
Tampa residents save $1.95 per night by switching from alcoholic to non-alcoholic beverages at bars – ranking 14th among 15 major U.S. metros. The alcoholic basket (3 beers + 1 cocktail) totals $30.45, while the NA equivalent costs $28.50.
Florida’s average alcohol expenditure is $972 per adult annually. Local bar prices average $6.10 for beer, $12.80 for middle-grade cocktails, $13.20 for wine glasses, $5.80 for NA beer, and $10.20 for mocktails.
Four bar outings per month switching to NA drinks can save $7.80 monthly or $93.60 annually.
Atlanta
Atlanta residents save $1.40 per night by switching from alcoholic to non-alcoholic beverages at bars – ranking last (15th) among 15 major U.S. metros. The alcoholic basket (3 beers + 1 cocktail) totals $28.00, while the NA equivalent costs $26.60.
Georgia’s average alcohol expenditure is ~$850 per adult annually. Local bar prices average $5.60 for beer, $11.80 for middle-grade cocktails, $12.00 for wine glasses, $5.20 for NA beer, and $9.20 for mocktails.
Four bar outings per month switching to NA drinks can save $5.60 monthly or $67.20 annually.
How many nights out would it take to save $1,000 by going sober in the biggest U.S. metros?
Dry January per-night savings look good on paper (in some metros), but how many bar nights does it actually take to save $1,000 after switching from alcoholic to non-alcoholic drinks? Across the biggest U.S. metros, the answer varies wildly – from quick wins to a serious wait.
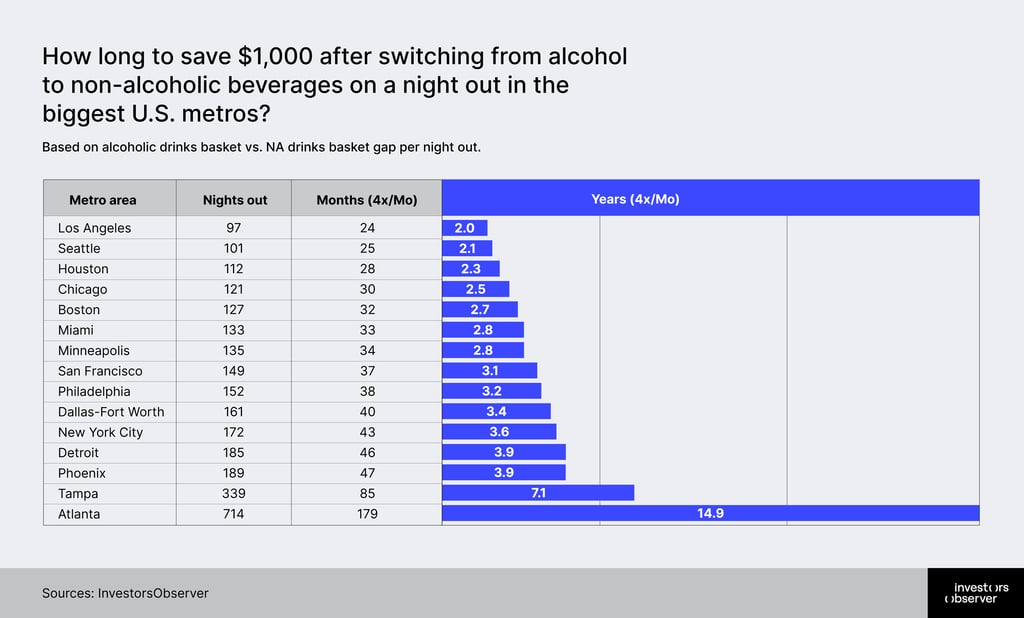
Top metros like Los Angeles deliver $10.30 per night out, hitting the target in just 97 outings (24 months at 4 nights monthly). Atlanta drinkers face $1.40 nightly gaps, stretching to 714 nights or nearly 15 years – barely moving the needle on emergency funds or debt paydown.
Mid-tier cities have a 3-4 year range, balancing feasibility with patience. New York at $6.20/night requires 161 outings (40 months at 4 nights monthly), while Phoenix's $5.80 takes 172 (43 months at 4 nights monthly). These timelines suit disciplined savers, potentially covering a used car down payment or holiday buffer if paired with consistent tracking.
“$1,000 from switching from alcohol to non-alcoholic beverages on a night out sounds great, until Atlanta needs 15 years of bar nights. In this case, location trumps discipline, meaning your metro’s bar pricing decides if Dry January delivers real budget relief or just health benefits. Top cities turn $10/night gaps into quick wins, while bottom ones shrink savings to irrelevant change over decades. Smart money always checks local math first,” explains Bourgi.
Limitations
This analysis draws from 7-10 TripAdvisor-listed bars per city, potentially skewing toward tourist hotspots or top-rated spots while missing dive bars and ultra-luxury venues. It uses standard evening menu prices only – no happy hours, seasonal deals, taxes, or tips.
The focus is on bar drinks only, ignoring at-home booze (where NA savings might differ), plus extras like rideshares or late snacks that sober switches could cut. The results give directional insights for nights out, not full-year spending overhauls.
Methodology and sources
This analysis combines 2024 average alcohol spending per adult for private consumption by state from SmartAsset with bar pricing from the 15 largest U.S. metro areas. For each metro, 7-10 venues were selected from TripAdvisor's “bars & pubs” listings, scanning down until online menus showed drink prices (including some lounges, restaurants, and pizzerias).
The middle-grade options were chosen for all the drinks, avoiding the most expensive and cheapest options on the menus, and if available, the house option was selected.
The average price was calculated by adding 7-10 middle-grade drinks, depending on menu availability in the metro area (beer, wine, cocktail), and dividing by the number accordingly, to get the average price.
The research team then used the data to calculate the following:
- The difference between an alcoholic drinks basket and NA drinks basket
- How much can one save a month if when going out four times a month switching from alcoholic beverages to NA beverages
- How much can one save a year if going out four times a month switching from alcoholic beverages to NA beverages
- How many nights out (months and years) it would take to save $1,000 by switching from alcoholic beverages to NA beverages on a night out