America’s most popular grocery brands now cost $741 more a year than 6 years ago – $41 of it hidden inside a smaller bag
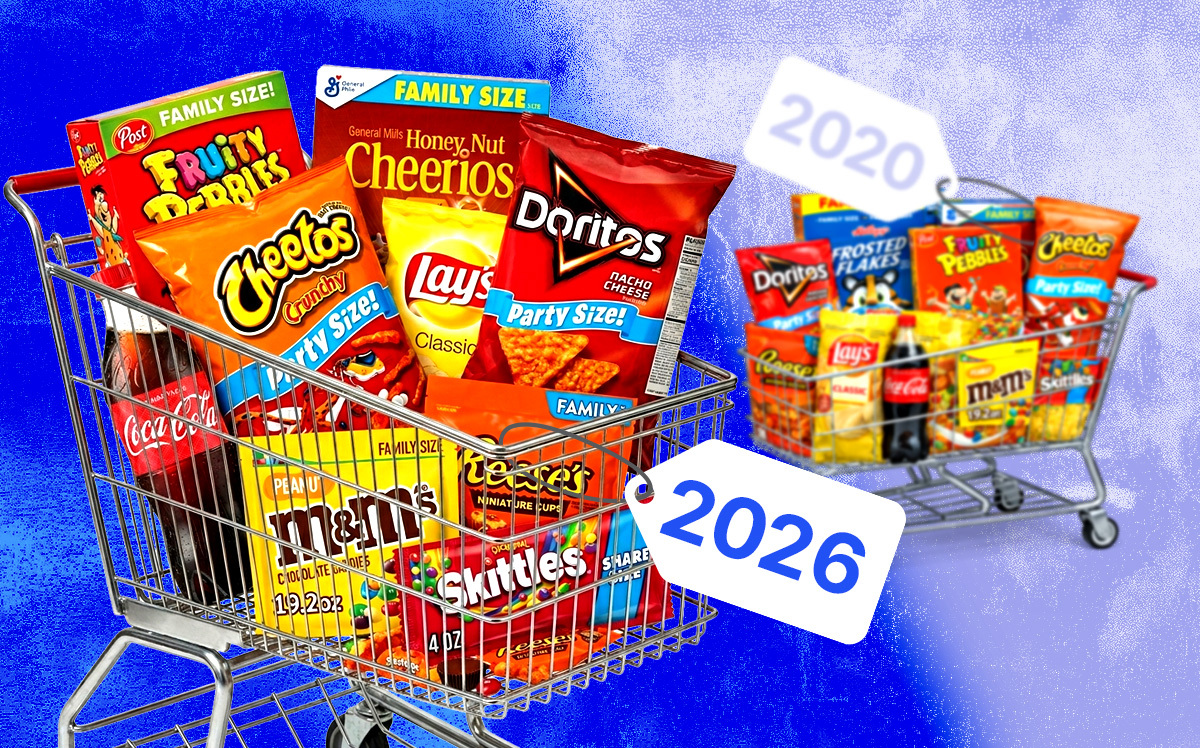
Every week, millions of American families load the same brands into the same cart – Frosted Flakes, Doritos, Coca-Cola, Campbell's soup, M&M’s.
The brands haven’t changed, but the bill has. And in many cases, so has the size of the bag.
A new InvestorsObserver analysis tracked the price and package size of America’s most popular grocery brands across six years, from 2020 to 2026.
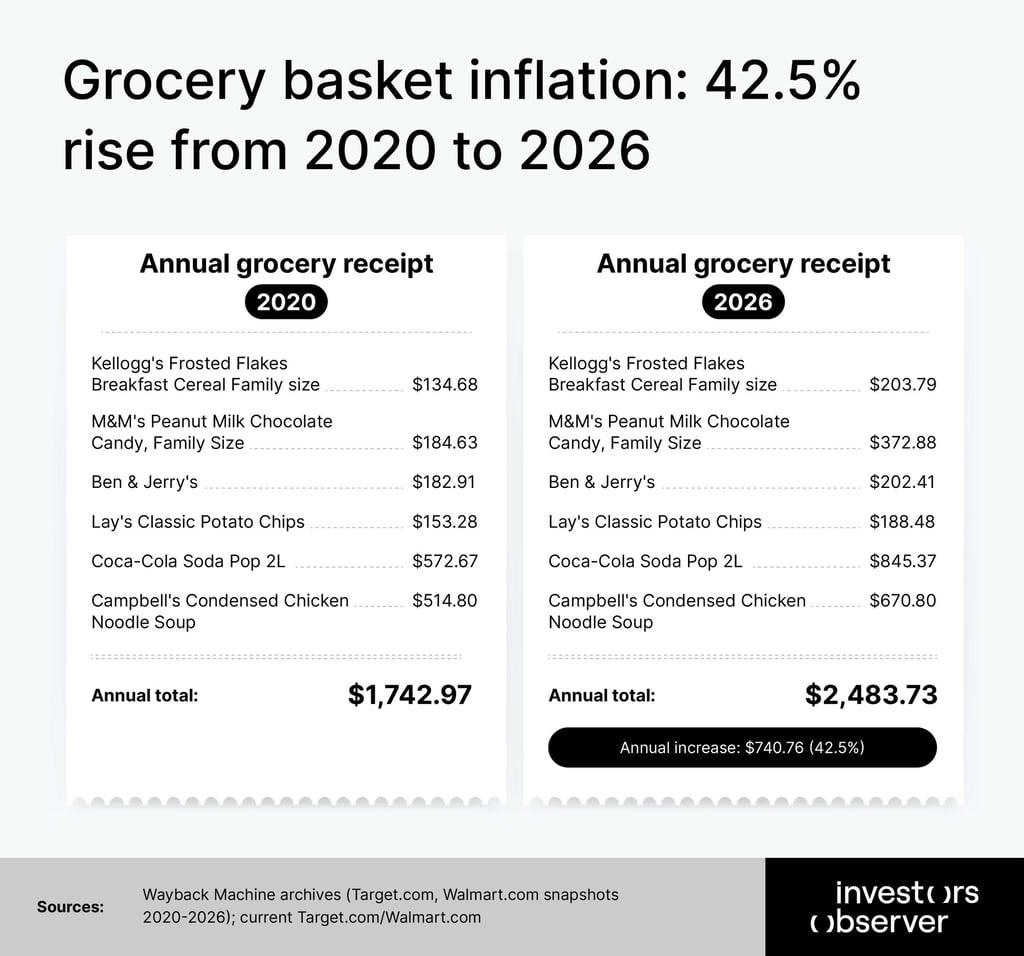
What it found: the average family of four is now spending $741 more a year – for the exact same groceries. And $41 of that increase never showed up on a price tag but rather saw a package decrease.
The practice has a name: shrinkflation – when brands don’t just raise prices, but quietly put less product in the same package, hoping consumers won't notice.
Key findings
- The average American family of four is spending $741 more a year than in 2020 – for the exact same groceries.
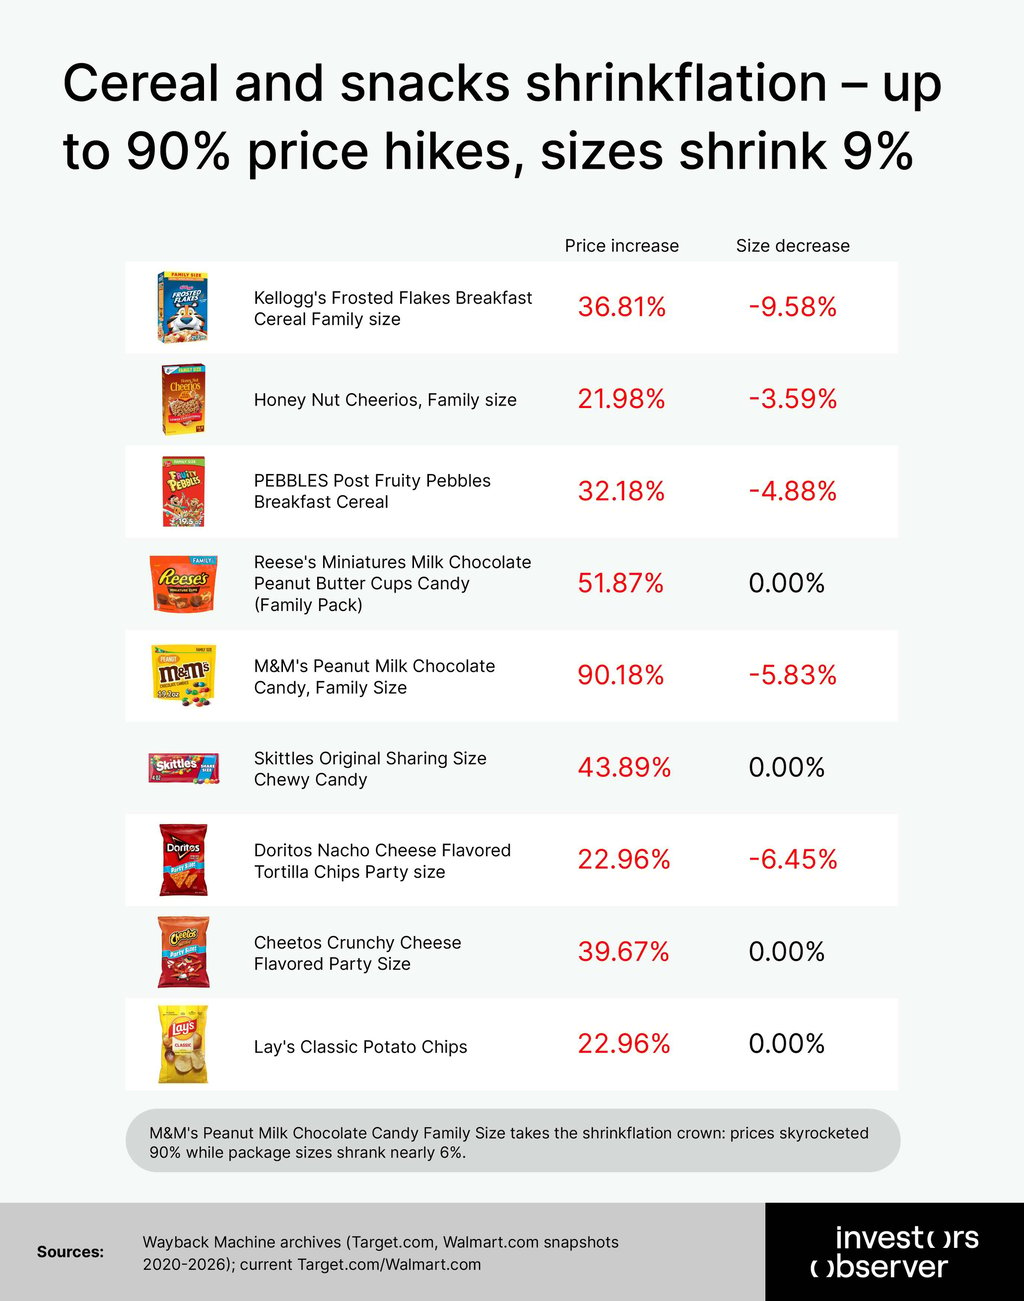
- Four of America's most beloved brands – Frosted Flakes, Doritos, M&M’s and Cheerios – quietly shrank their packages while raising prices.
- A box of Frosted Flakes now costs 51% more per serving than in 2020, and there are fewer servings inside.
- Buying the same Coca-Cola in mini cans costs up to 127% more per ounce than the 2L bottle.
Coca-Cola is among the latest brands to face scrutiny, after introducing its 7.5oz mini cans for single-serve purchases. The company continues experimenting with packaging and pricing, even after being formally accused by U.S. senators in 2024 of exploiting consumers through shrinkflation.
“No one is surprised by growing prices these days, but the issue with shrinkflation is the silence around it. You can clearly see when gas prices grow or rent rises – but in this case, you don’t notice when you start to overpay for less. It lands hardest on those who can afford the least,” said Sam Bourgi, senior analyst at InvestorsObserver.
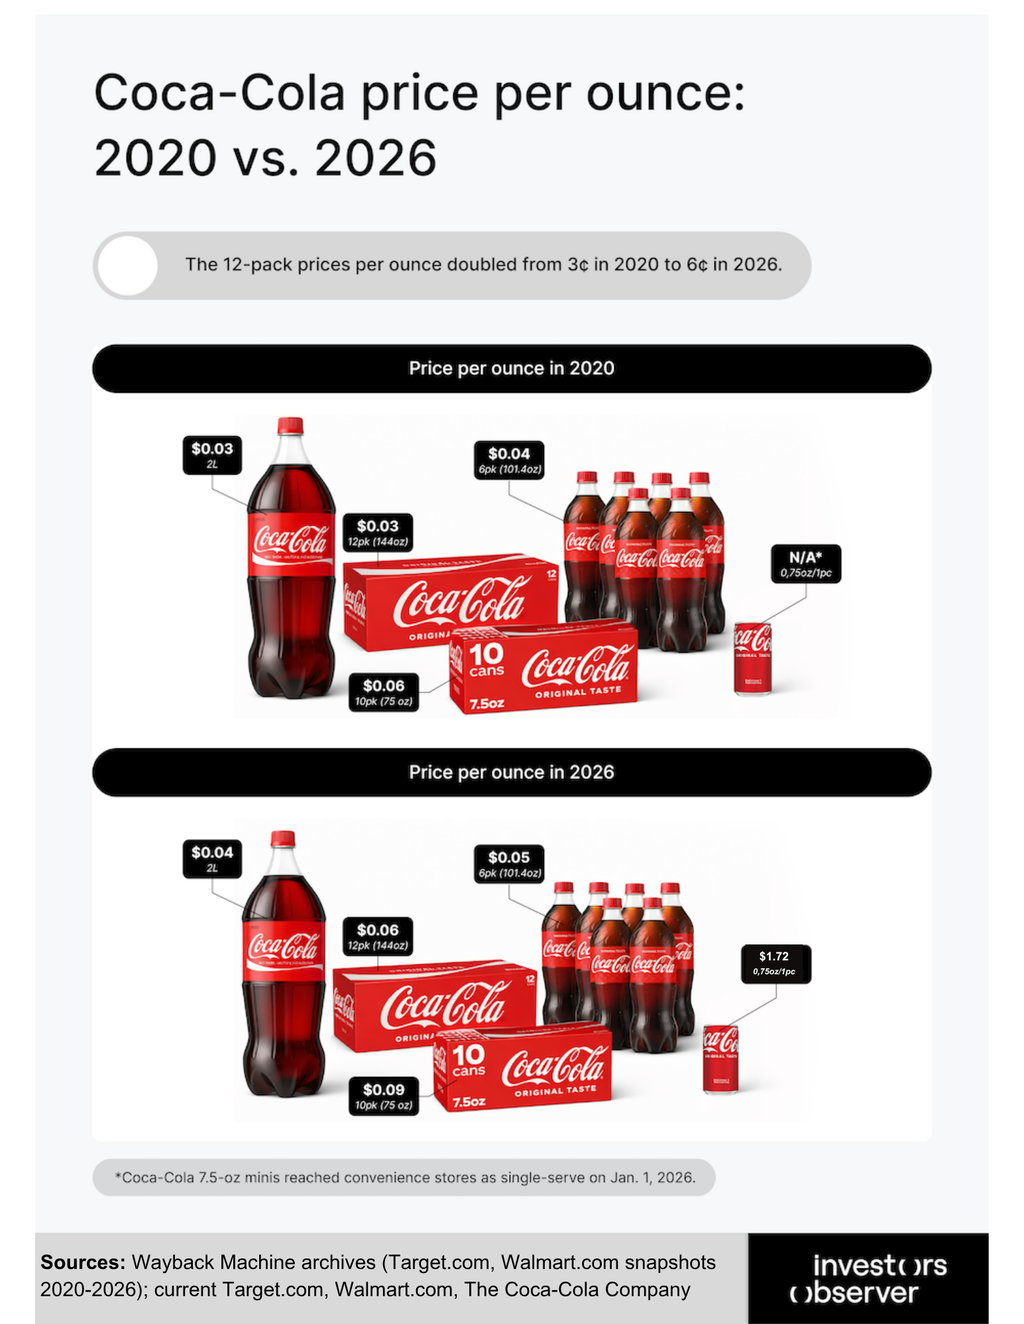
Coca-Cola: a can is up to 126% more expensive than a bottle
Of all the brands in this analysis, Coca-Cola tells the most complete story, because it sold the same drink in four different sizes, at four very different prices.
A 2-liter bottle of Coke cost $1.89 in 2020. Today it costs $2.79 – a 48% increase over six years, which is significant. But it’s not the most expensive way to buy Coke.
The 12-pack of cans – the format most American families reach for – jumped from $4.89 to $8.89. That’s an 82% price increase since 2020. A case of Coke that once cost less than $5 now costs nearly $9.
Then there are the mini cans. Coca-Cola has aggressively pushed its 7.5oz “portion control” format in recent years, marketing it as the smarter, healthier choice.
Consumers buying the 10-pack of mini cans are paying 126% more per ounce than shoppers who buy the 2-liter bottle. The same Coke, but more than double the cost.
In January 2026, Coca-Cola expanded the individual mini can format to convenience stores nationwide. When asked about the pricing, the company called it “portion innovation”.
“The simplest advice we can give any Coca-Cola drinker right now: buy the 2-liter. Our data shows it’s the best value format by a wide margin, and that gap has only grown since 2020. The mini can costs more than twice as much per sip. Most people had no idea,” said Bourgi.
Doritos, Frosted Flakes, M&M’s: how three brands hit you twice – one move at a time
Most people catch a price hike. When a bag of Doritos jumps from $4.79 to $5.99, the receipt says on it. But what happens when the price stays the same, and the bag just gets a little lighter?
That’s the second move. And the data suggests it often comes after shoppers have already absorbed the first shock.
In 2021, a 15.5-oz bag of Doritos Nacho Cheese cost $4.79. In 2022, the same bag cost $5.99. Following that, in 2023, the price stayed the same, but the bag shrank to 14.5 oz. A 14.4-oz bag of Doritos Nacho Cheese now costs $6.69.
That means the bag got 1 oz smaller, but also $1.90 more expensive. While 1 oz may not sound like much, it is roughly one serving.
“It is a lot more difficult to notice changes in size than in price. However, shrinkflation can have an enormous effect on low-income households, where every dollar, every ounce, and every serving matters. This phenomenon can easily further limit their ability to afford groceries,” said Bourgi.
A similar pattern appears with Kellogg’s Frosted Flakes Breakfast Cereal. In 2022, a 24-oz box cost $3.98. By 2024, the same family-sized box had shrunk to 21.7 oz and cost $5.48. For losing more than two recommended servings of cereal, shoppers were paying over $1 more.
In 2025, the price fell 9% to $4.98, while the size remained 21.7 oz.
M&M’s followed a longer timeline. Prices rose steadily from 2020 through 2023. Then in 2024, Mars shrank the bag from 19.2 oz to 18.08 oz while prices continued to rise. By 2026, a bag of M&M’s cost $9.49, up from $4.99 in 2020.
Your cereal box and your candy bag both got hit – just not at the same time
Both major cereal brands shrank their family-size boxes, but at different times and scales. Kellogg's Frosted Flakes lost 2.3 oz (9.6%) in 2023, a year after its first price hike.
Price per ounce rose 51% overall. Frosted flakes had a price correction in 2025, dropping from $5.48 to $4.98 (9.1%).
M&M’s Peanut held its 19.2 oz size until 2024, when it decreased to 18.08 oz. Price per ounce doubled (+102%) over the recorded period.
While Skittles held the size at 15.6oz, it only raised the price by 44%. Reese’s Miniatures also held the size at 17.6oz, but raised the price by 52%.
“Shrinkflation is not only an economic thing, to some extent, but it also exploits consumer ethics. In my eyes, it is crazy to raise prices more than twice, and then next year quietly make the products smaller,” said Bourgi. “When brands don’t announce these movements, they strip buyers of their ability to make informed purchasing decisions. ”
2021 was the year that brands like M&M's, Honey Nut Cheerios, and Pepsi began raising prices before the broader wave.
But 2022 had the biggest single-year jumps. Coca-Cola 10-pack mini cans surged 43% in one year. Doritos jumped 25%. Lay's, Cheetos, and Häagen-Dazs all posted double-digit increases.
Frosted Flakes and Doritos both shrank in 2023, a year after their largest price hikes. The companies raised prices first, then quietly reduced package sizes as a secondary measure.
By 2025, most prices had stopped rising, but they stopped at levels between 22% and 102% above where they were in 2020.
Brands freeze prices in 2026 – but no one’s giving back bigger packages
For the first time since 2020, most of America's biggest food brands stopped raising prices in 2026. But don’t mistake a pause for a reversal.
Of the 16 brands tracked in this analysis, nine held their prices completely flat between 2025 and 2026.
Frosted Flakes, Doritos, Lay’s, Cheetos, and Coca-Cola all stayed put. Two brands – Honey Nut Cheerios and Campbell’s soup – actually got slightly cheaper. Cheerios dropped from $4.93 to $4.44. Campbell's fell from $1.39 to $1.29.
That sounds like good news. Here's the part that isn’t.
Honey Nut Cheerios is still 22% more expensive than it was in 2020. And the box is still smaller.
Campbell’s is still 30% above its 2020 price. The brands gave back cents. Six years of increases kept the dollars.
Not every brand got the memo about slowing down. Reese’s raised its price 15% in 2026 alone – the largest single-year increase of any product in the most recent data – crossing $10 a bag for the first time.
M&M’s, already the worst offender in the entire dataset, raised prices another 6.7% on top of everything else.
Regarding the packages, every brand that shrank its bag or box between 2022 and 2024 kept the new smaller size in 2026.
No brand restored what it took away. The smaller bag became the new normal – quietly, without announcement, and without reversal.
Brands like Ben & Jerry’s and Campbell's Soup remained the most stable
Not every brand raised prices and shrank packages. While cereals, chips, and candy repeatedly raised prices and shrank packages, the freezer aisle did something different.
Ben & Jerry’s raised its price by just 10.7% over six years – from $4.69 to $5.19 – and never touched the packaging.
Breyers and Häagen-Dazs followed a similar path, ending 2026 only 11% and 17% above their 2020 prices respectively.
No shrinking, no two-step strategy was done. Just modest, transparent price increases that tracked broadly with inflation.
The contrast with the rest of the dataset is strong. While M&M’s doubled in cost per ounce and Doritos quietly removed a serving from the bag, ice cream brands held their containers at the same size they’ve always been.
“That matters because it proves the shrinkflation strategy was a choice, not a necessity,” explained Bourgi. “If rising costs forced brands to shrink packages, every brand would have done it. They didn't. Some held the line. Which means the ones that didn’t make a deliberate decision to give consumers less without telling them”.
Why shrinkflation is designed to be invisible
Shrinkflation is a trick designed to fly under the radar. While people tend to notice a price increase, especially when families count the budget or buy the same favorite brands for years, a steep $1 or $2 rise is visible on the receipt. However, shrinking the packaging size is something that is rarely noticed.
A new study found that consumers are more responsive to price adjustments than to changes in product size. This is a psychological trick that can be exploited, as the packages can be deceptive.
According to data, who notices shrinkflation also varies: baby boomers (70%) were much more likely to report noticing multiple instances of shrinkflation than Gen Zers (48%) and millennials (54%). Gen Zers (80%) are most likely to say they even stopped purchasing products because of shrinkflation.
Methodology
Products tracked:
- Breakfast cereal: Kellogg's Frosted Flakes, Family Size (primary product), Honey Nut Cheerios, Family Size (alternative product).
- Candy and chocolate: M&M's Peanut, Family Size (primary product), Skittles Original, Sharing Size (alternative product).
- Frozen goods: Ben & Jerry's Pint (16 oz) (primary product), Häagen-Dazs Vanilla Bean (14 oz) (alternative product).
- Snack foods: Lay's Classic Potato Chips (13 oz) (primary product), Doritos Nacho Cheese, Party Size (alternative product).
- Soda: Coca-Cola 2L (primary product), Pepsi 2L (alternative product).
- Soup: Campbell's Condensed Chicken Noodle (primary product), Progresso Traditional Chicken Noodle (alternative product).
Products were chosen based on brand recognition, widespread retail availability, and representation of distinct parent companies where possible. M&M’s and Skittles are both Mars Inc. products.
Additional Coca-Cola formats (12-pack cans, 10-pack mini cans, 6-pack bottles) were tracked separately for a format pricing analysis but excluded from the household cost model to avoid double-counting.
Three additional products – Reese's Miniatures Family Pack (17.6 oz), Breyers Original Ice Cream (48 oz), Fruity Pebbles Breakfast Cereal (19.5 oz) and Cheetos Crunchy Cheese Flavored Party Size (15 oz) were tracked for price trends but excluded from the household cost model due to incomplete 2020 baseline data (Reese's Miniatures data begins in 2022; Häagen-Dazs in 2025) or to avoid double-counting within the frozen dessert category (Breyers) and snack foods (Cheetos).
The price of Coca‑Cola’s 7.5‑oz mini cans for single‑serve purchases was obtained from a Coca‑Cola Company press release, which provided a recommended retail price for convenience stores. The corresponding price per ounce was then calculated.
Baseline and comparison period
The baseline year is 2020 (pre-pandemic inflation baseline). The comparison year is 2026 (current). Annual data points from 2020 through 2026.
Price and package size data
Retail shelf prices and net weight (oz) were collected for each product from the following sources:
Wayback Machine snapshots of Target.com and Walmart.com product and category pages, targeting one snapshot per year. Specific archived URLs are documented per data point in the spreadsheet.
Current retail pricing from Target.com and Walmart.com directly (February 2026).
For each product and year, the following data points were recorded: product name, brand, category, retailer, package size (oz), shelf price ($), price per oz, year-over-year changes in price, size, and price/oz, and the source URL.
Household consumption model
Annual purchase frequencies for a household of four were derived from national per capita consumption data, scaled to four persons. Each product represents the full category consumption.
Annual Consumption Estimates (U.S. Household of 4)
- Breakfast cereal: ~14 lbs (224 oz) per capita / 896 oz per household (Industry report)
- Candy and chocolate: ~11 lbs (176 oz) per capita / 704 oz per household (Research (old), NHANES)
- Frozen goods: ~0.05 cups/day (~156 oz/year) per capita / 624 oz per household (USDA)
- Snack foods: ~6.6 lbs (~105.6 oz) per capita / 422.4 oz per household (Source)
- Soda: 41.9 gallons (~5,363 oz) per capita / 20,480 oz per household (IBISWorld)
- Soup — ~2.5 units/week (~1,397.5 oz/year) per capita / 5,590 oz per household (Statista)
Limitations
- This analysis tracks eight specific branded products and does not claim to represent the entire grocery basket or all consumer spending.
- Prices were collected from whichever major retailer (Target or Walmart) had the best archived data for a given year. While both are national retailers with broadly comparable pricing, minor retailer-specific differences may exist.
- The model assumes consistent consumption volume (i.e., a household seeks to maintain consumption levels), which may not account for changes in consumer behavior. Consumption is calculated based on per capita consumption, which may not reflect true household consumption.
- Canned soup consumption data were derived from Statista household survey data rather than USDA per capita availability data.