Businesses from these 33 U.S. states would have absorbed $11 billion of Greenland tariffs
President Trump’s threatened Greenland tariffs – paused days after announcement – would have imposed an additional $11 billion on Americans across 33 most exposed states, not Europeans, as many assume.
Despite administration claims that foreign exporters bear tariff costs, a Kiel Institute study has found that U.S. importers and consumers absorb 96% of the burden.
The additional 10% tariffs targeting the UK, Germany, France, Sweden, Denmark, Netherlands, Finland, and Norway were withdrawn following EU resistance, with Trump citing a “framework of a future deal” on Greenland.
Whether economic exposure influenced the reversal remains unclear. What’s certain: 33 U.S. states faced concentrated costs across automotive and pharmaceutical sectors – costs that would have hit American households directly.
The following state-by-state analysis of U.S. states that have targeted European countries as their top 5 import partners reveals exactly where those costs would have landed – and why the economic exposure made Trump’s tariff threats unsustainable.
Key findings
- U.S. businesses and consumers would have borne 96% of the total tariff burden – $26.78 billion out of $27.9 billion in combined baseline and Greenland tariffs.
- 33 U.S. states count one or more of the eight targeted European countries among their top 5 import partners, and would have faced $11.36 billion in additional Greenland tariff costs between Feb–Dec 2026.
- In these 33 states, U.S. businesses and consumers would have had to absorb $10.91 billion in Greenland tariff costs between Feb–Dec 2026.
- Georgia, North Carolina, and New Jersey would have absorbed $7 billion in combined tariff costs.
- 31 states count Germany among their top 5 import partners, with Maryland and Rhode Island ranking Germany as their No. 1 partner.
The 10 states Trump’s retreat saved most
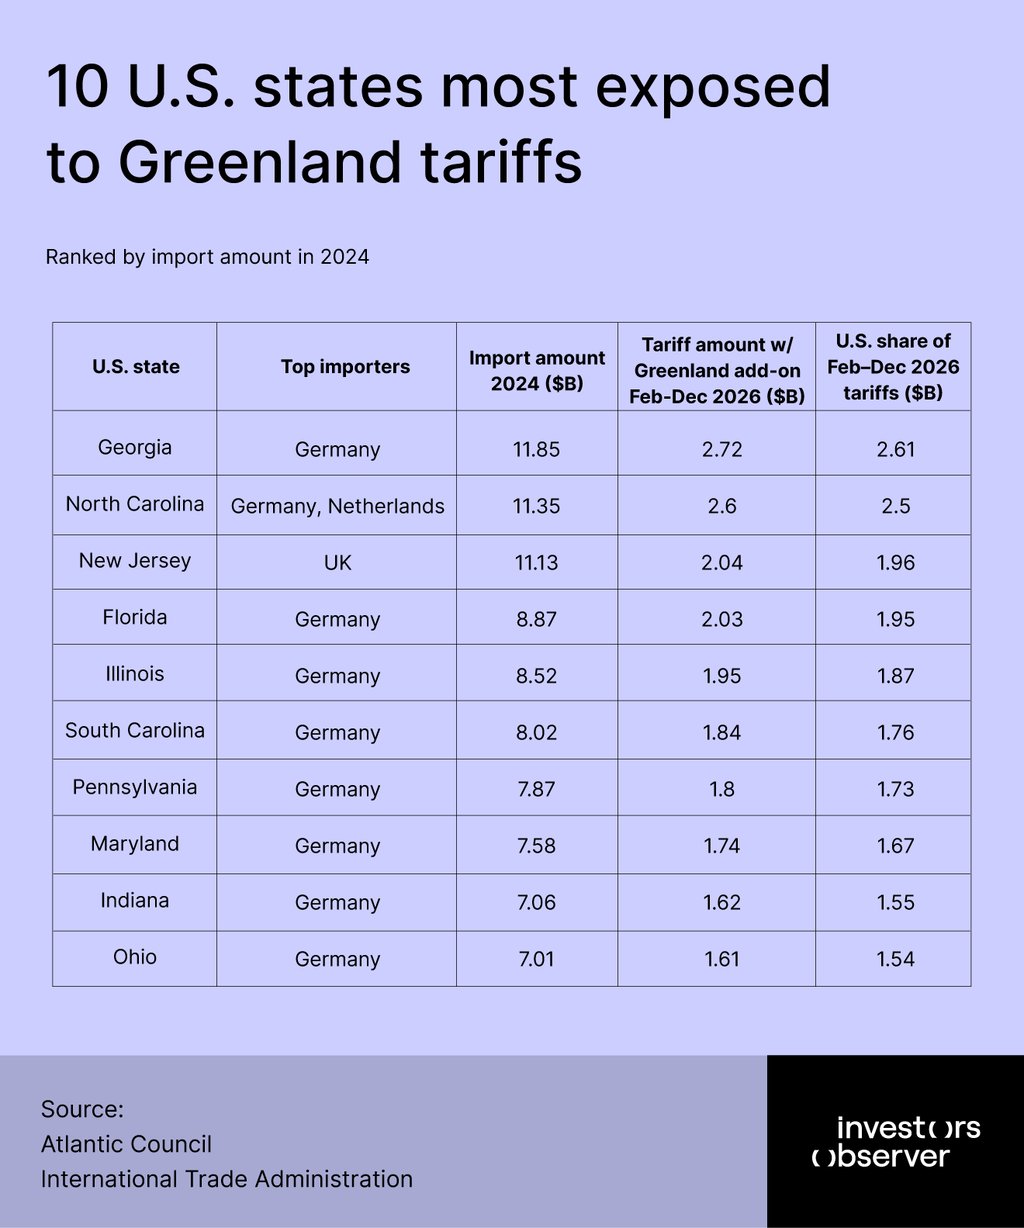
These 10 U.S. states would have faced over $18 billion in overall tariff costs between Feb–Dec 2026 due to the Greenland add-on, with Georgia, North Carolina, and New Jersey leading the exposure.
Germany dominates seven states’ imports, particularly auto-heavy manufacturing hubs like Georgia and Indiana.
“While Trump's retreat spares these states for now, the analysis exposes deep supply chain vulnerabilities, especially in automotive and machinery sectors dependent on Germany. If trade tensions reignite, states like Georgia and North Carolina have billions of dollars at stake. The threat may be postponed, but the structural exposure remains,” said Sam Bourgi, senior analyst at InvestorsObserver.
Georgia
Georgia would have faced the highest tariff exposure of any U.S. state under Trump’s proposed Greenland tariffs, with $11.85 billion in 2024 imports from Germany and an estimated $2.72 billion in newly structured tariffs from February through December 2026 under the combined 25% rate.
This would have translated into $2.61 billion in costs for U.S. businesses and consumers, of which $1.09 billion would have been just the Greenland cost.
However, Germany’s automotive sector has an additional 25% sector-specific tariff, bringing the total potential tariff to 50% for vehicles. For Georgia, this means that the tariffs might have increased even further, depending on the volume of vehicles imported from Germany.
Georgia's import-dependent economy would have confronted a severe shock that could have rippled through automotive dealerships, manufacturing facilities, port operations, and ultimately consumer wallets across the state.
North Carolina
North Carolina comes second with $11.35 billion total from Germany and Netherlands in 2024 imports. Tariff exposure between Feb–Dec 2026 could have reached $2.6 billion post-Greenland add-on, targeting pharma and machinery in Research Triangle biotech hubs.
This would have translated into $2.5 billion in costs for U.S. businesses and consumers, of which $1.04 billion would have been just the Greenland cost.
The state’s top import products were pharmaceuticals with $21.2 billion in 2024, while Netherlands’ annual $7 billion pharma products were the top one export industry to the U.S.
New Jersey
New Jersey ranks third among U.S. states most exposed to Greenland tariffs. The state imported $11.13 billion from the UK in 2024, and would have faced $2.03 billion in 20% tariffs with Greenland add-on.
This would have translated into $1.96 billion in costs for U.S. businesses and consumers, of which $1.02 billion would have been just the Greenland cost.
Statewide motor vehicle imports reached $16.7 billion annually, while the UK’s vehicle industry is among top exported products to the U.S. with $11.64 billion.
Pharmaceutical products rank among top export industries from the UK to the U.S., while New Jersey imported $12B in pharmaceuticals in 2024, ranking among its top three products.
New Jersey families would have had to prepare to encounter pricier British pharmaceuticals and equipment amid high living costs.
Florida
Florida ranks fourth among U.S. states affected by Trump’s Greenland tariffs on European imports. In 2024, Germany was Florida’s third-largest importer, with $8.87 billion in goods exported to the state.
Under the new tariff structure, Florida would have faced a 25% combined baseline and Greenland add-on tariff, which would have resulted in $1.96 billion in tariffs between Feb–Dec 2026.
This would have translated into $1.95 billion in costs for U.S. businesses and consumers, of which $0.81 billion would have been just the Greenland cost.
This significant increase would have impacted Florida’s economy, particularly affecting industries reliant on German imports including vehicles, machinery, and pharmaceuticals.
Illinois
Illinois ranks fifth among U.S. states affected by Trump’s Greenland tariffs on European imports. In 2024, Germany was Illinois's fifth-largest importer, with $8.52 billion in goods exported to the state.
Under the new tariff structure, Illinois would have faced a 25% combined baseline and Greenland add-on tariff, which would have resulted in $1.84 billion in overall tariffs between Feb–Dec 2026.
This would have translated into $1.87 billion in costs for U.S. businesses and consumers, of which $0.78 would have been just the Greenland cost.
Pharmaceuticals were among Illinois’s top imported products with $16.6 billion in value, and Germany’s top third export industry to the U.S. is also pharmaceuticals.
This suggests that Illinois’s pharma imports likely include significant German supply, and it would have amplified tariff vulnerability.
The new tariffs would have driven up healthcare costs for 12.6 million residents.
South Carolina
South Carolina ranks sixth among U.S. states that would have been affected by Trump’s Greenland tariffs on European imports. In 2024, Germany was South Carolina’s second-largest importer, with $8.02 billion in goods exported to the state.
Under the new tariff structure, South Carolina would have faced a 25% combined baseline and Greenland add-on tariff, which would have resulted in $1.8 billion in overall tariffs between Feb–Dec 2026.
This would have translated into $1.76 billion in costs for U.S. businesses and consumers, of which $0.74 would have been just the Greenland cost.
In South Carolina, vehicles lead imports at $8.7 billion, matching Germany’s No. 1 U.S. export (vehicles, $3.5 billion).
Pennsylvania
Pennsylvania ranks seventh among U.S. states that would have been affected by Trump's Greenland-related tariffs on European imports. In 2024, Germany was Pennsylvania’s fourth-largest importer, with $7.87 billion in goods exported to the state.
Under the new tariff structure, Pennsylvania would have faced a 25% combined baseline and Greenland add-on tariff, which would have resulted in $1.74 billion in overall tariffs between Feb–Dec 2026.
This would have translated into $1.73 billion in costs for U.S. businesses and consumers, of which $0.72 would have been just the Greenland cost.
In Pennsylvania, pharmaceuticals and medicine lead imports at $35.7 billion, and motor vehicles come second at $8.3 billion in value.
These industries are among top U.S. exports for Germany, which suggests that Pennsylvania’s residents should have braced themselves for higher prices in healthcare and cars.
Maryland
Maryland ranks eighth among U.S. states that would have been most affected by Trump's Greenland-related tariffs on European imports. In 2024, Germany was Maryland’s fourth-largest importer, with $7.58 billion in goods exported to the state.
Under the new tariff structure, Maryland would have faced a 25% combined baseline and Greenland add-on tariff, resulting in $1.62 billion in overall tariffs between Feb–Dec 2026.
This would have translated into $1.67 billion in costs for U.S. businesses and consumers, of which $0.69 would have been just the Greenland cost.
Considering that 50% auto sector add-on is applied to German vehicle imports, Maryland's total tariff burden could have increased even further.
In Maryland, motor vehicles ($15.7 billion) and machinery ($2.5 billion) are the top two imported product categories, mirroring Germany’s top two U.S. exports. This suggests that Maryland’s economy might have been heavily impacted by the Greenland tariffs.
Indiana
Indiana ranks ninth among U.S. states that would have been affected by Trump’s Greenland-related tariffs on European imports. In 2024, Germany was Indiana’s fourth-largest importer, with $7.06 billion in goods exported to the state.
Under the new tariff structure, Indiana would have faced a 25% combined baseline and Greenland add-on tariff, which would have resulted in $1.61 billion in overall tariffs between Feb–Dec 2026.
This would have translated into $1.55 billion in costs for U.S. businesses and consumers, of which $0.65 would have been just the Greenland cost.
Indiana’s top imports are pharmaceuticals and medicine ($43,8 billion), and motor vehicle parts ($6.5 billion), and these are among Germany’s top U.S. exports, which suggest that Indiana’s economy could have been quite significantly affected by the new tariffs.
Ohio
Ohio ranks tenth among U.S. states that would have been affected by Trump’s Greenland-related tariffs on European imports. In 2024, Germany was Ohio's fourth-largest importer, with $7.01 billion in goods exported to the state.
Under the new tariff structure, Ohio would have faced a 25% combined baseline and Greenland add-on tariff, which would have resulted in $1.61 billion in overall tariffs between Feb–Dec 2026.
This would have translated into $1.54 billion in costs for U.S. businesses and consumers, of which $0.64 would have been just the Greenland cost.
Considering that the 50% auto sector add-on is applied to vehicle imports, Ohio’s total tariff burden could have increased even further.
Ohio’s top imports are pharmaceuticals and medicine ($8.9 billion), and motor vehicle parts ($8.8 billion), and these are among Germany’s top U.S. exports, which suggest that Ohio’s economy could have been quite significantly affected by the new tariffs.
Mid-tier hotspots: 13 states that would have absorbed $2.8 billion of Greenland tariffs
Beyond the top ten most-exposed states, 13 additional states would have faced substantial new tariff burdens ranging from $200 million to $1.24 billion between Feb–Dec 2026 under Trump’s Greenland tariffs.
Despite their smaller absolute numbers, these states still count Germany among their top five import partners, which shows how European trade relationships extend across the entire American economy, from major manufacturing hubs to smaller regional economies.
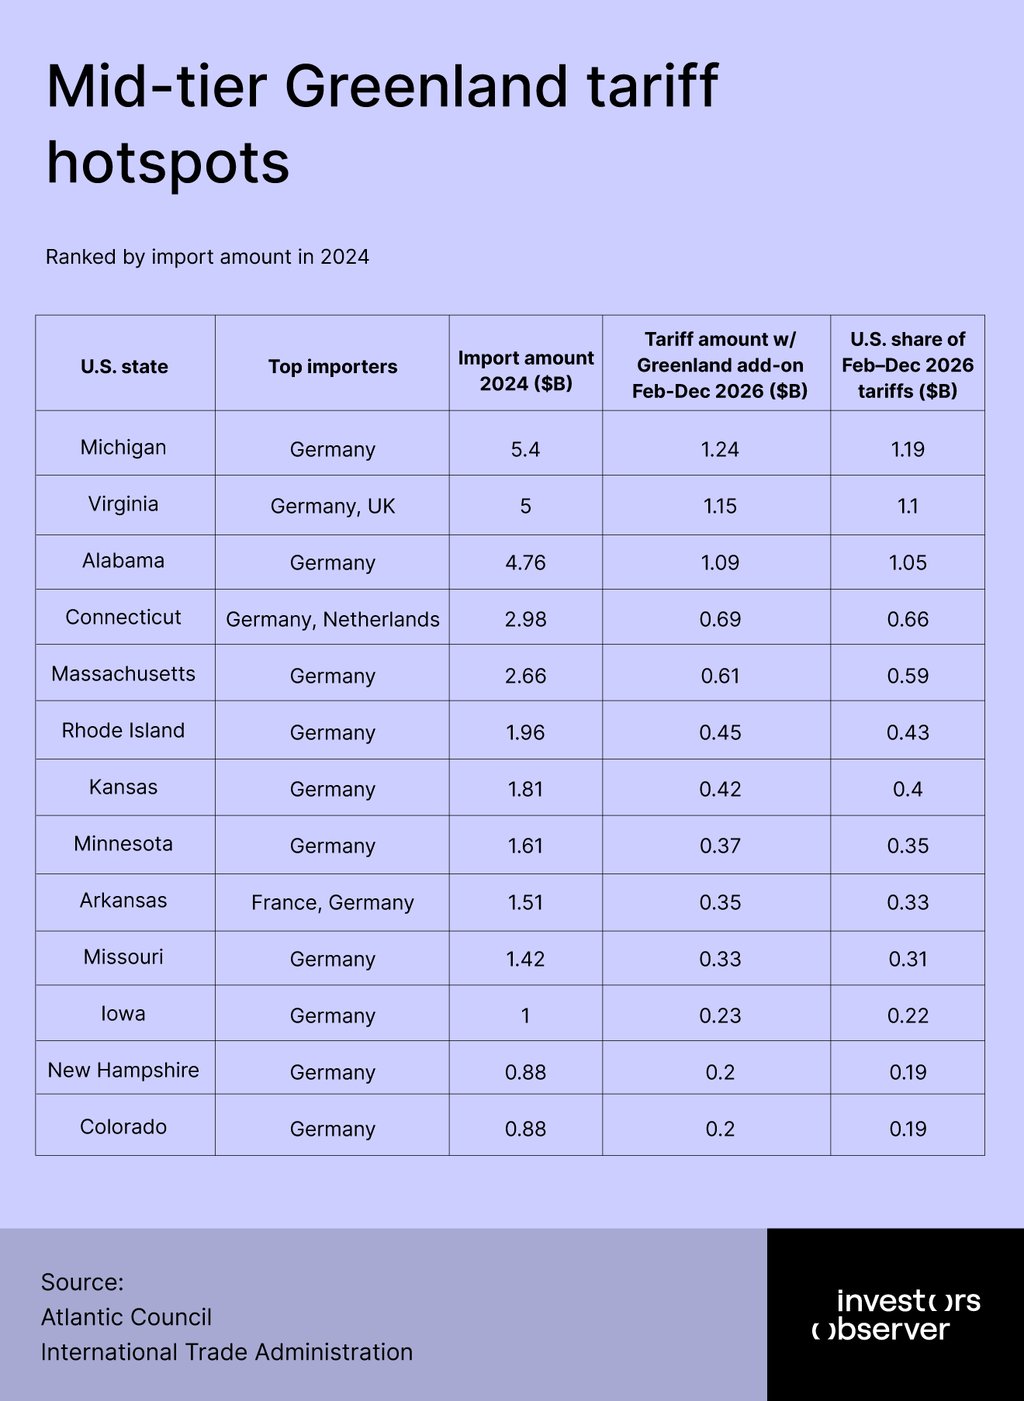
In 2024, Michigan had $5.4 billion in German imports and might have faced $1.24 billion in tariff costs under the 25% combined rate. As the traditional heart of American automotive manufacturing, Michigan’s exposure is due to its deep integration with German auto supply chains.
Virginia follows with $5 billion in imports from both Germany and the UK, and would have resulted in $1.15 billion in tariffs.
Alabama imported $4.76 billion in German goods in 2024 and might have faced $1.09 billion in new tariff exposure, largely driven by its significant automotive manufacturing sector anchored by Mercedes-Benz and other European automakers.
Connecticut received goods from Germany and the Netherlands for $2.98 billion in value, and would have $690 million in tariffs.
Massachusetts follows with $2.66 billion in German imports and $610 million in tariffs, while Rhode Island is next with $1.96 billion in German goods resulting in $450 million in tariff costs. These states’ exposure reflects their specialized manufacturing sectors and pharmaceutical industries that rely heavily on European imports.
Kansas imported goods from Germany for $1.81 billion, and might have faced $420 million in tariffs. Minnesota is close with $1.61 billion in imports, $370 million in tariffs.
Missouri with $1.42 billion in German imports might have faced $330 million in tariffs, while Iowa with $1 billion in German imports would have had to deal with $230 million in tariff exposure.
Arkansas presents a unique profile having imported goods from France and Germany as top partners for $1.51 billion, which would have resulted in $350 million in combined tariff costs.
New Hampshire and Colorado, each importing $880 million in German goods, and each would have faced $200 million in tariffs.
10 states with smaller-scale exposure to cancelled Greenland tariffs
Among the states that have targeted European countries as their top five import partners, these states would have been exposed the least.
While major manufacturing states would have faced billions in potential tariff costs, a smaller group of states had considerably lower exposure to Trump’s Greenland tariffs on European imports, though they still maintain significant trade relationships with the targeted European countries.
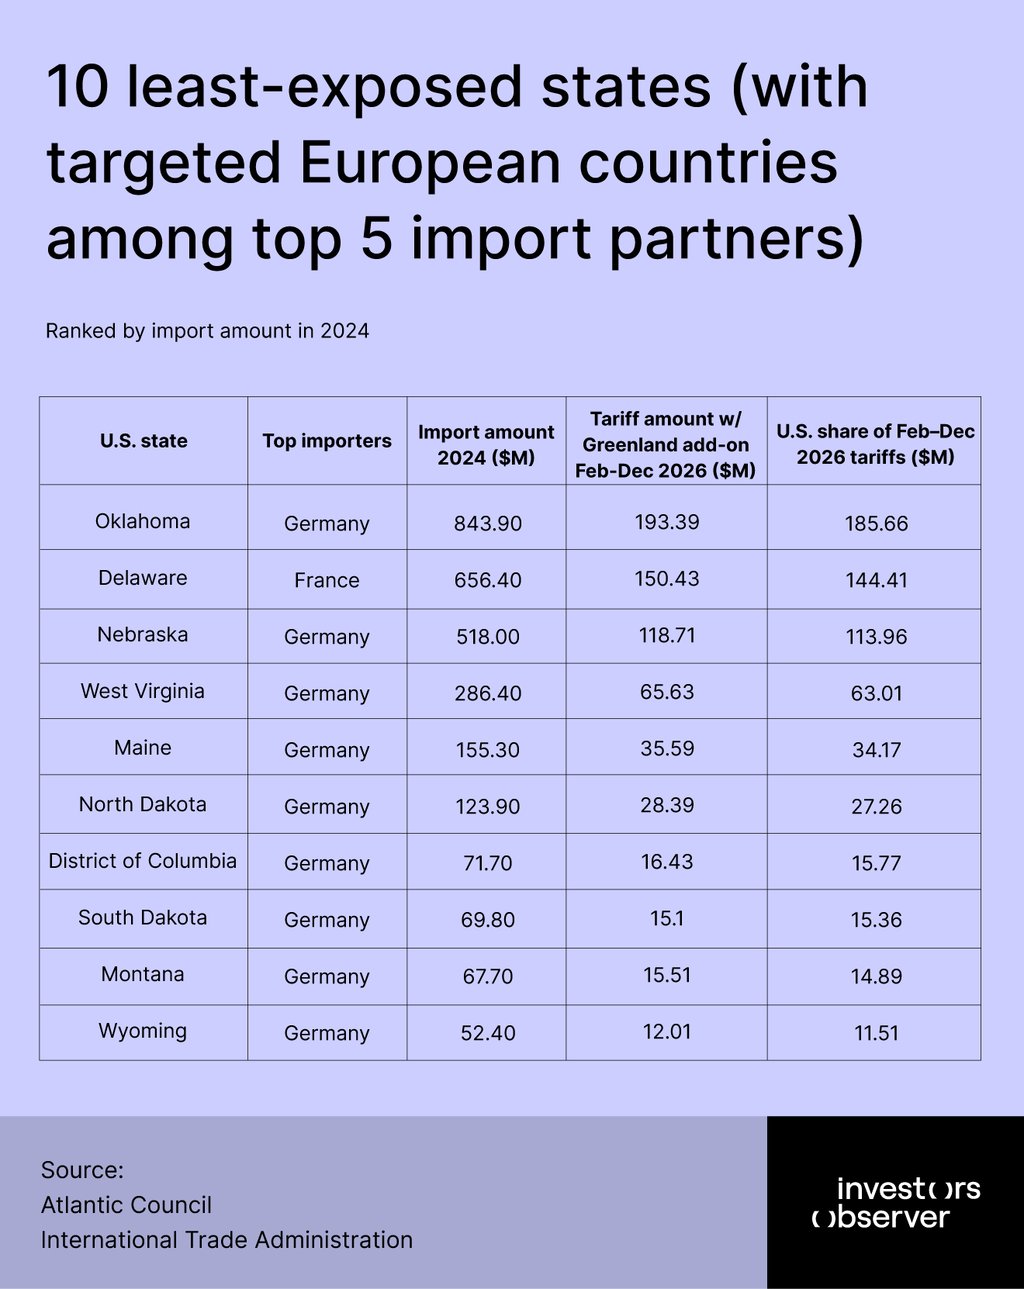
At the bottom of the exposure scale, three predominantly rural states would have faced the smallest tariff burdens. Wyoming, with Germany as its third-largest importer, imported just $52.4 million in German goods in 2024, which would have resulted in only $12 million in newly structured tariffs.
Montana follows with $67.7 million in German imports and $15.51 million in tariffs, while South Dakota in 2024 imported $69.8 million from Germany, and would have faced $15.1 million in tariffs.
Despite their small absolute exposure, these agricultural and energy-focused states still count Germany among their top five trading partners, showing the breadth of transatlantic commerce.
What Greenland tariffs on each targeted European country would have cost Americans nationwide
U.S. imports from key European countries targeted in the Greenland tariff dispute show mixed trends when comparing full-year 2024 figures to Jan–Oct 2025 data, which would have translated into varying Greenland tariff costs for Americans businesses and consumers.
Across the U.S. – not just in the states which have targeted European countries as their top five import partners – the total Greenland tariff burden for Americans would have been $31.88 billion between Feb–Dec 2026.
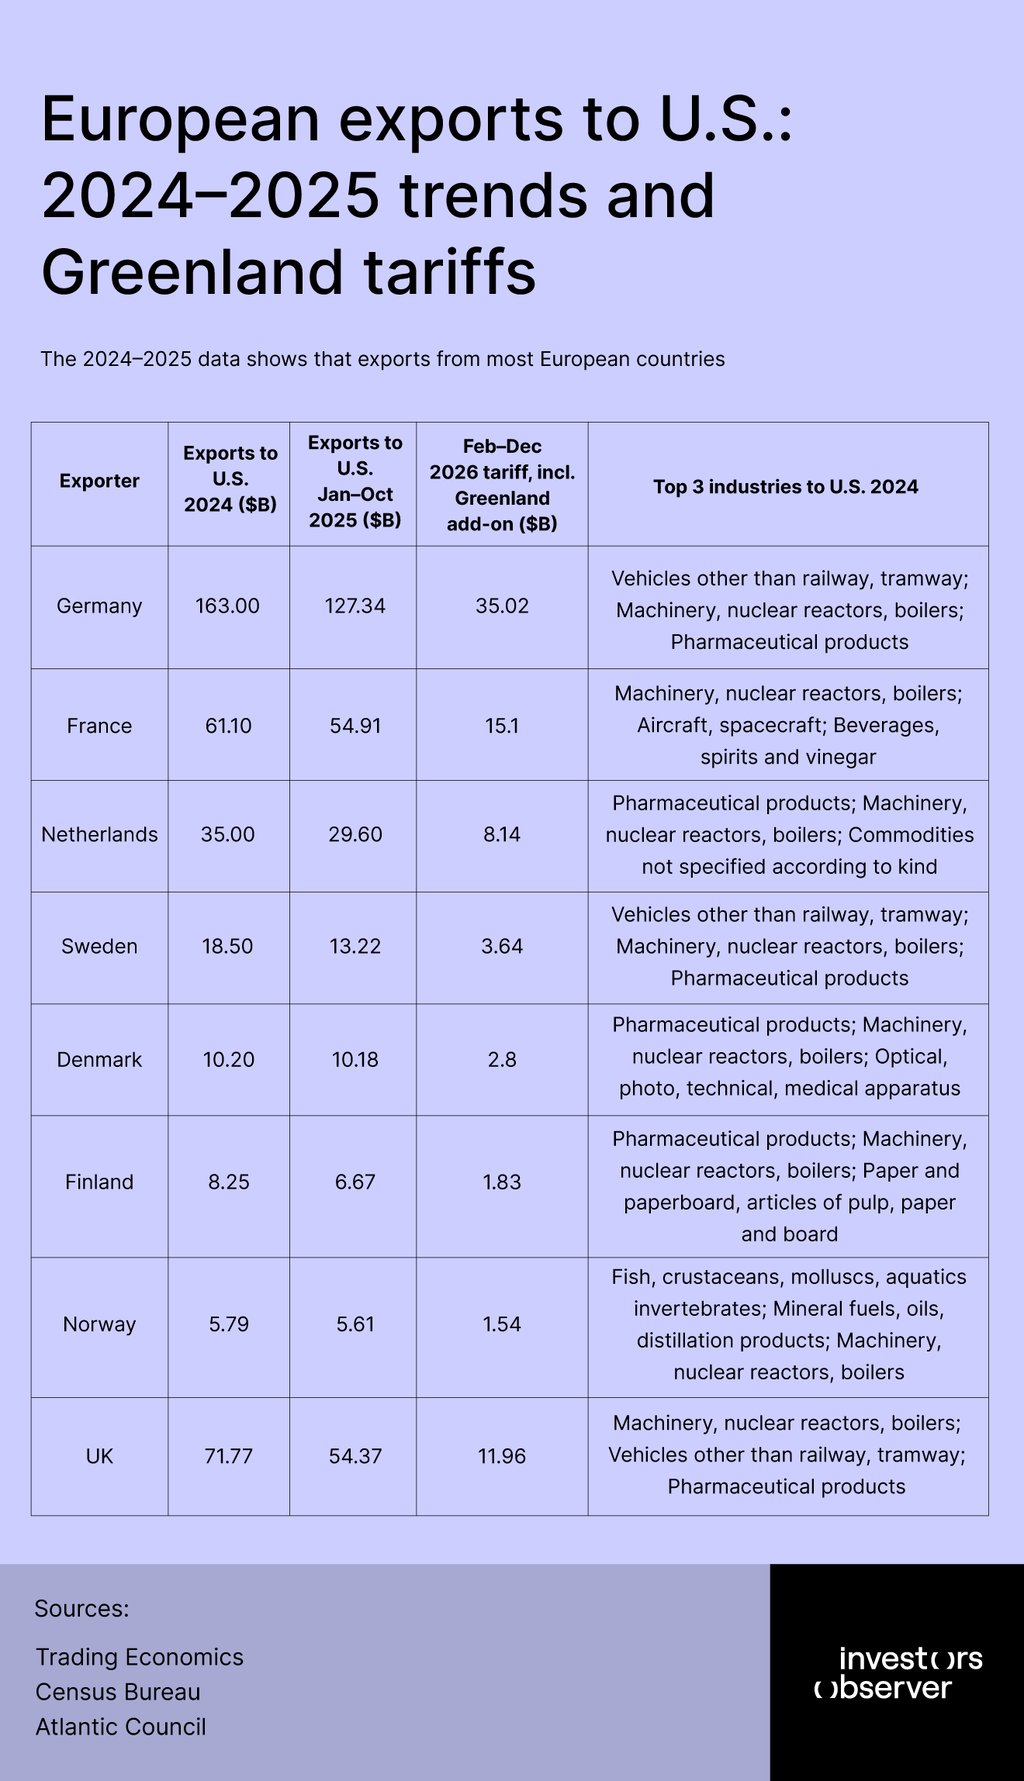
Germany, the largest exporter at $163 billion in 2024 (monthly average $13.58 billion), had Jan–Oct 2025 exports of $127.34 billion, equating to a monthly average of $12.73 billion – a 6.25% decline from 2024’s pace.
Across the U.S., Greenland tariff on Germany would have imposed the heaviest tariff burden on American consumers and businesses, accounting for $13.45 billion, based on monthly U.S. export average in 2025.
The UK follows with $71.77 billion in 2024 (monthly $5.98 billion), but January–October 2025 averaged $5.44 billion monthly, up 9.09% year-over-year. Greenland tariff on the UK would have imposed an additional $5.8 billion on Americans across the country.
France’s monthly U.S. export average in 2024 was $5.09 billion, and $5.49 billion in 2025 – a 7.84% change. Greenland tariff on France would have imposed an additional $5.74 billion on Americans across the country.
Denmark had the strongest increase at 19.76% (monthly average from $0.85 billion to $1.02 billion), and Norway fell 16.27% ($0.48 billion to $0.56 billion). The Greenland tariff burden for Americans would have been $1.08 billion and $0.59 billion respectively.
Sweden’s monthly average of U.S. exports declined from $1.54 billion 2024 to $1.32 billion in 2025. The Greenland tariff burden for Americans would have been $1.4 billion.
The Netherlands remained nearly flat, with its 2024 monthly average of $2.92 billion shifting to $2.96 billion in 2025 – a minor 1.49% increase, which shows resilience in pharmaceuticals amid broader automotive and machinery sector pressures seen in Germany and Sweden.
Greenland tariff on the Netherlands would have imposed an additional $3.13 billion on Americans across the country.
Limitations
State-level projections use 2024 import data due to unavailable 2025 state-by-state figures, while nationwide calculations incorporate Jan–Oct 2025 export trends.
Import volumes from Germany and other European partners declined during 2025, meaning actual tariff costs would likely have fallen below these estimates.
The analysis assumes U.S. importers and consumers would absorb 96% of tariff costs based on Kiel Institute research. All figures represent hypothetical scenarios following the January 2026 tariff cancellation.
Methodology and sources
The data was sourced from:
-
Trading Economics
- European import into the U.S. and top industries by country 2024
-
Census Bureau
- European import values into the U.S. January-October 2025
-
International Trade Administration
- Import values into U.S. states 2024, including top imported products and top import partners by state
-
Atlantic Council (Trump Tariff Tracker)
- Currently agreed U.S. tariff rates for Europe
Greenland add-on is the additional tariff of 10% announced by President Trump on imports from eight European countries – Denmark, Norway, Sweden, France, Germany, UK, Netherlands, and Finland.
For each U.S. state, the new total tariff amount consisting of baseline tariff and Greenland add‑on, Feb–Dec 2026 ($B), was calculated by:
- Estimating the annual tariff amount with the Greenland add‑on ($B) using 2024 import values and the agreed baseline plus Greenland tariff rates
- Multiplying that annual amount by 11/12 to obtain the Feb–Dec 2026 total
For each U.S. state, the Greenland tariff amount Feb–Dec 2026 ($B), was calculated by:
- Taking each state’s import amount 2024 ($B) to estimate the annual Greenland tariff
- Multiplying that annual amount by 11/12 to obtain the Greenland tariff for Feb–Dec 2026
For each European country, Feb–Dec 2026 tariff, incl. Greenland add-on ($B) was calculated by:
- Multiplying 2025 monthly average ($B) by 11 (Feb–Dec months), then
- Applying baseline + Greenland tariff rates to that total