
Active exchange-traded funds are drawing more attention than ever this year, attracting a large share of new investments – especially from retirees. But with so many options available, how can investors tell which funds are worth their money?
To answer this question, the Investors Observer research team developed the Active ETF Performance Index.
This index evaluates actively managed equity ETFs by combining year-to-date (YTD) and year-over-year (YoY) returns with net asset inflows. The resulting scores make it easy to distinguish top performers (scores above 0.4) from the weakest (scores below 0.2).
Through this analysis, we uncover important trends in investor behavior and highlight which funds are truly effective during the ongoing surge in active ETF popularity.
Key findings
- YieldMax MSTR Option Income Strategy ETF (MSTY) tops the index with a 25.5% YTD return, a huge 106% YoY gain, and $4.5 billion in net inflows, despite its higher 0.99% expense ratio.
- International and value-focused ETFs like Dimensional International Value (DFIV) and Avantis International Small Cap Value (AVDV) also scored high, delivering over 21% YTD returns and strong inflows.
- Several top-performing ETFs, including Avantis International Equity (AVDE) and Capital Group Dividend Value (CGDV), combined solid returns (9–20% YTD) with large inflows, showing broad investor appeal.
- The worst-performing ETFs, such as Avantis U.S. Small Cap Value (AVUV) and Dimensional U.S. Small Cap Value (DFSV), recorded negative YTD returns (down 6.4% and 5.8%) and low index scores, despite some inflows.
- JPMorgan Equity Premium Income ETF (JEPI) attracted $6.9 billion in inflows but had only a 1.3% YTD return, highlighting that strong inflows don’t always mean strong performance.
- Most bottom-ranked ETFs had low fees (as low as 0.12%), but this didn’t help them outperform the market or attract enough investor interest.
- Niche or sector ETFs like First Trust North American Energy Infrastructure Fund (EMLP) saw minimal inflows ($0.19 billion) despite strong yearly returns (27.6% YoY), likely due to high fees and sector risk.
Top 10 best-performing active ETFs by index score
The best performing active ETFs are ranked by index score (higher = better), starting with the best performing active ETF.

YieldMax MSTR Option Income Strategy ETF (MSTY) delivered a remarkable 25.48% YTD and 105.98% YoY return, with $4.53 billion in net inflows and a 0.99% expense ratio. It outperformed SPY by 22.34% YTD and 93.53% YoY, reflecting strong investor interest in its single-stock, covered-call strategy despite elevated risk and high fees.
Dimensional International Value ETF (DFIV) posted 21.44% YTD and 22.88% YoY gains, attracting $3.07 billion in inflows at a 0.27% expense ratio. It outperformed SPY by 18.3% YTD and 10.43% YoY, driven by strong international value exposure and steady investor confidence, despite occasional sector volatility.
Avantis International Small Cap Value ETF (AVDV achieved 21.13% YTD and 25.07% YoY returns, with $2.32 billion in net inflows and a 0.36% expense ratio. It outperformed SPY by 17.99% YTD and 12.62% YoY, benefiting from robust demand for international small-cap value exposure and consistent growth.
Dimensional International Small Cap Value ETF (DISV) returned 22.89% YTD and 22.64% YoY, with $0.84 billion in net inflows and a 0.42% expense ratio. It outperformed SPY by 19.75% YTD and 10.19% YoY, leveraging developed-market small-cap value stocks and demonstrating strong, consistent performance.
Avantis International Equity ETF (AVDE) generated 20.09% YTD and 20.20% YoY returns, with $2.03 billion in net inflows and a 0.23% expense ratio. It outperformed SPY by 16.95% YTD and 7.75% YoY, offering broad international equity exposure and cost efficiency, appealing to diversified investors.
Capital Group Dividend Value ETF (CGDV) reported 9.36% YTD and 17.23% YoY returns, with $7.73 billion in net inflows and a 0.33% expense ratio. It outperformed SPY by 6.22% YTD and 4.78% YoY, focusing on large-cap dividend payers and attracting significant investor capital.
Dimensional International Core Equity 2 ETF (DFIC) achieved 19.68% YTD and 19.60% YoY returns, with $2.23 billion in net inflows and a 0.23% expense ratio. It outperformed SPY by 16.54% YTD and 7.15% YoY, emphasizing core international equities and low costs, attracting long-term investors.
Fidelity Enhanced International ETF (FENI) posted 20.19% YTD and 17.87% YoY returns, with $1.21 billion in net inflows and a 0.29% expense ratio. It outperformed SPY by 17.05% YTD and 5.42% YoY, leveraging international large-cap stocks and offering enhanced exposure at a modest cost.
Avantis Emerging Markets Equity ETF (AVEM) delivered 14.71% YTD and 12.88% YoY returns, with $4.03 billion in net inflows and a 0.33% expense ratio. It outperformed SPY by 11.57% YTD and 0.43% YoY, providing emerging market exposure and strong inflows.
JPMorgan NASDAQ Equity Premium Income ETF (JEPQ) saw -1.19% YTD and 7.48% YoY returns, but attracted $12.64B in net inflows at a 0.35% expense ratio. It underperformed SPY by -4.33% YTD and -4.97% YoY, yet remained highly popular for its Nasdaq-focused income strategy and robust capital attraction.
10 worst-performing active ETFs by index score
The worst performing ETFs are ranked by their composite index score, beginning with the worst performer.
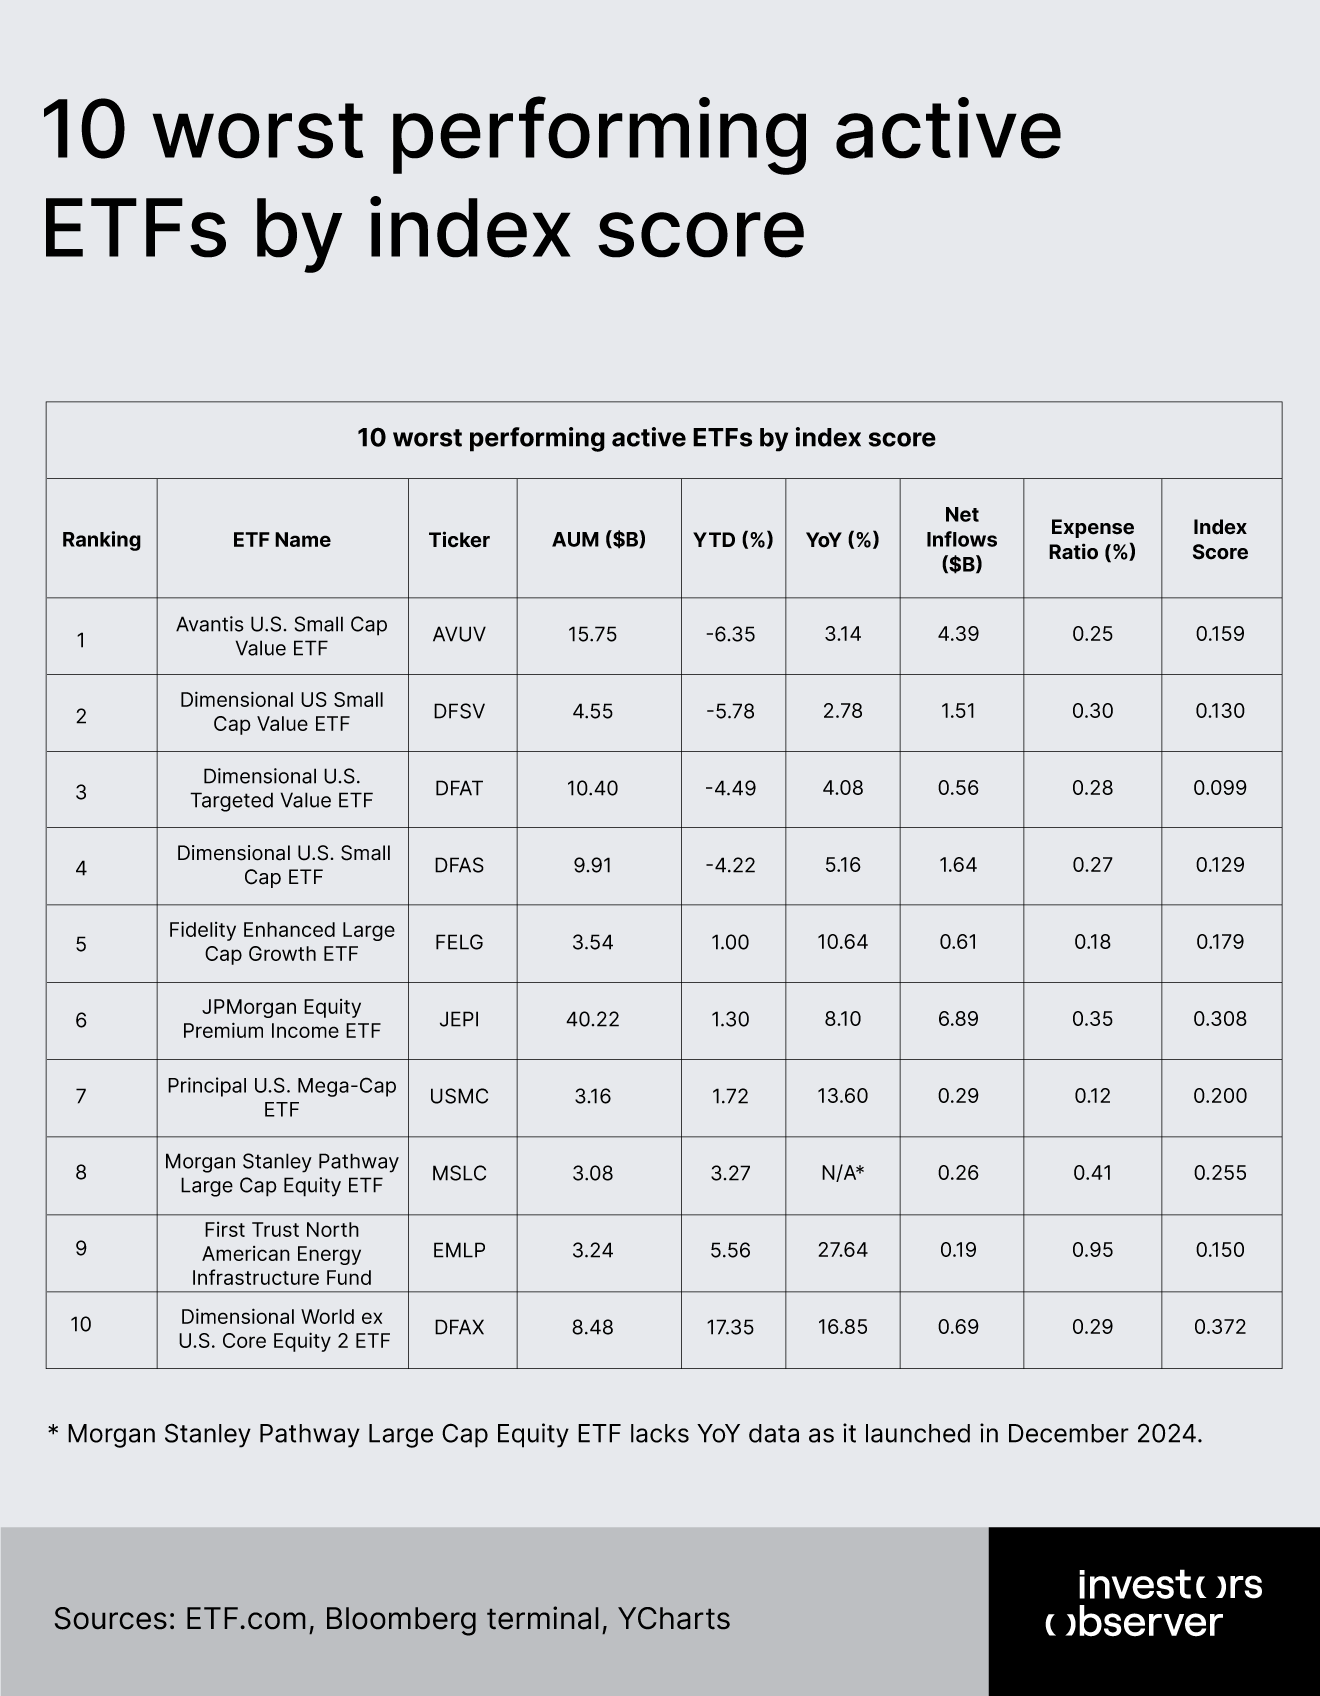
The worst-performing active ETFs, such as Avantis U.S. Small Cap Value ETF (AVUV) and Dimensional US Small Cap Value ETF (DFSV), posted negative YTD returns of -6.35% and -5.78% respectively. Despite attracting $4.39 billion and $1.51 billion in net inflows, their index scores are among the lowest, reflecting poor relative performance and investor concerns.
Dimensional U.S. Targeted Value ETF (DFAT) and Dimensional U.S. Small Cap ETF (DFAS) had -4.49% and -4.22% YTD returns, with YoY gains 4.08% and 5.16%. These funds, with expense ratios near 0.28%, underperformed the S&P 500 by wide margins, highlighting the challenge of justifying costs amid weak returns.
ETFs like Fidelity Enhanced Large Cap Growth (FELG) and Principal U.S. Mega-Cap (USMC) saw minimal inflows despite positive but modest YTD returns (1.0% and 1.72%). JPMorgan Equity Premium Income ETF (JEPI), with $6.89 billion in inflows, posted only 1.3% YTD, showing that high inflows do not always correlate with strong performance.
Implications for investors
The index score helps investors quickly see which active ETFs are truly delivering strong results and which are struggling. For example, top-scoring funds like MSTY (0.827), DFIV (0.485), and AVDV (0.473) combined high returns with robust inflows, showing they are both effective and popular. In contrast, low-scoring funds such as AVUV (0.159), DFSV (0.130), and DFAT (0.099) had weak returns and lower inflows, signaling persistent underperformance and less investor confidence.
Investors should look beyond just returns to consider how much new money is flowing into a fund and what fees are being charged. Some funds with strong inflows, like JEPQ and JEPI, may have weaker performance but still attract significant capital due to their income strategies or brand strength. Meanwhile, niche or high-fee funds may struggle to attract new money, even if they post good returns. The index score helps investors weigh these factors together, highlighting funds that offer the best balance of performance, cost, and investor trust.
By focusing on index scores, investors can make better-informed decisions about which active ETFs to include in their portfolios. High-scoring funds tend to be more reliable core holdings, offering both strong performance and broad investor appeal. Low-scoring funds may signal underlying issues, such as poor strategy execution or lack of investor confidence, and may be best avoided. Ultimately, using the index score as a starting point can help investors spot trends, manage risk, and build a more resilient, diversified investment strategy.
Methodology
The index combines three normalized metrics using equal weights (1/3 each):
- Year-to-date (YTD) performance (%)
- year-over-year (YoY) Performance (%)
- Net Inflows ($B)
Each metric is scaled 0-1 using min-max normalization. The index score is calculated as: Index Score = ⅓ × Norm. Norm. YTD + ⅓ × Norm. YoY + ⅓ × Norm. Inflows
This approach ensures both short-term momentum (YTD) and longer-term consistency (YoY) are considered, while net inflows reflect investor confidence. ETFs are ranked by their index score, with a higher score indicating better overall performance and investor appeal. Data is current as of June 16, 2025.
Sources
- ETF.com
- Bloomberg Terminal
- YCharts
Your email address will not be published. Required fields are markedmarked