
When thinking about investing in major U.S. companies, it helps to understand how attainable that really is for an average American worker earning minimum wage.
New research from InvestorsObserver shows that the affordability of owning a small portion, namely 1%, of some of the country's biggest firms has changed dramatically over the last three decades.
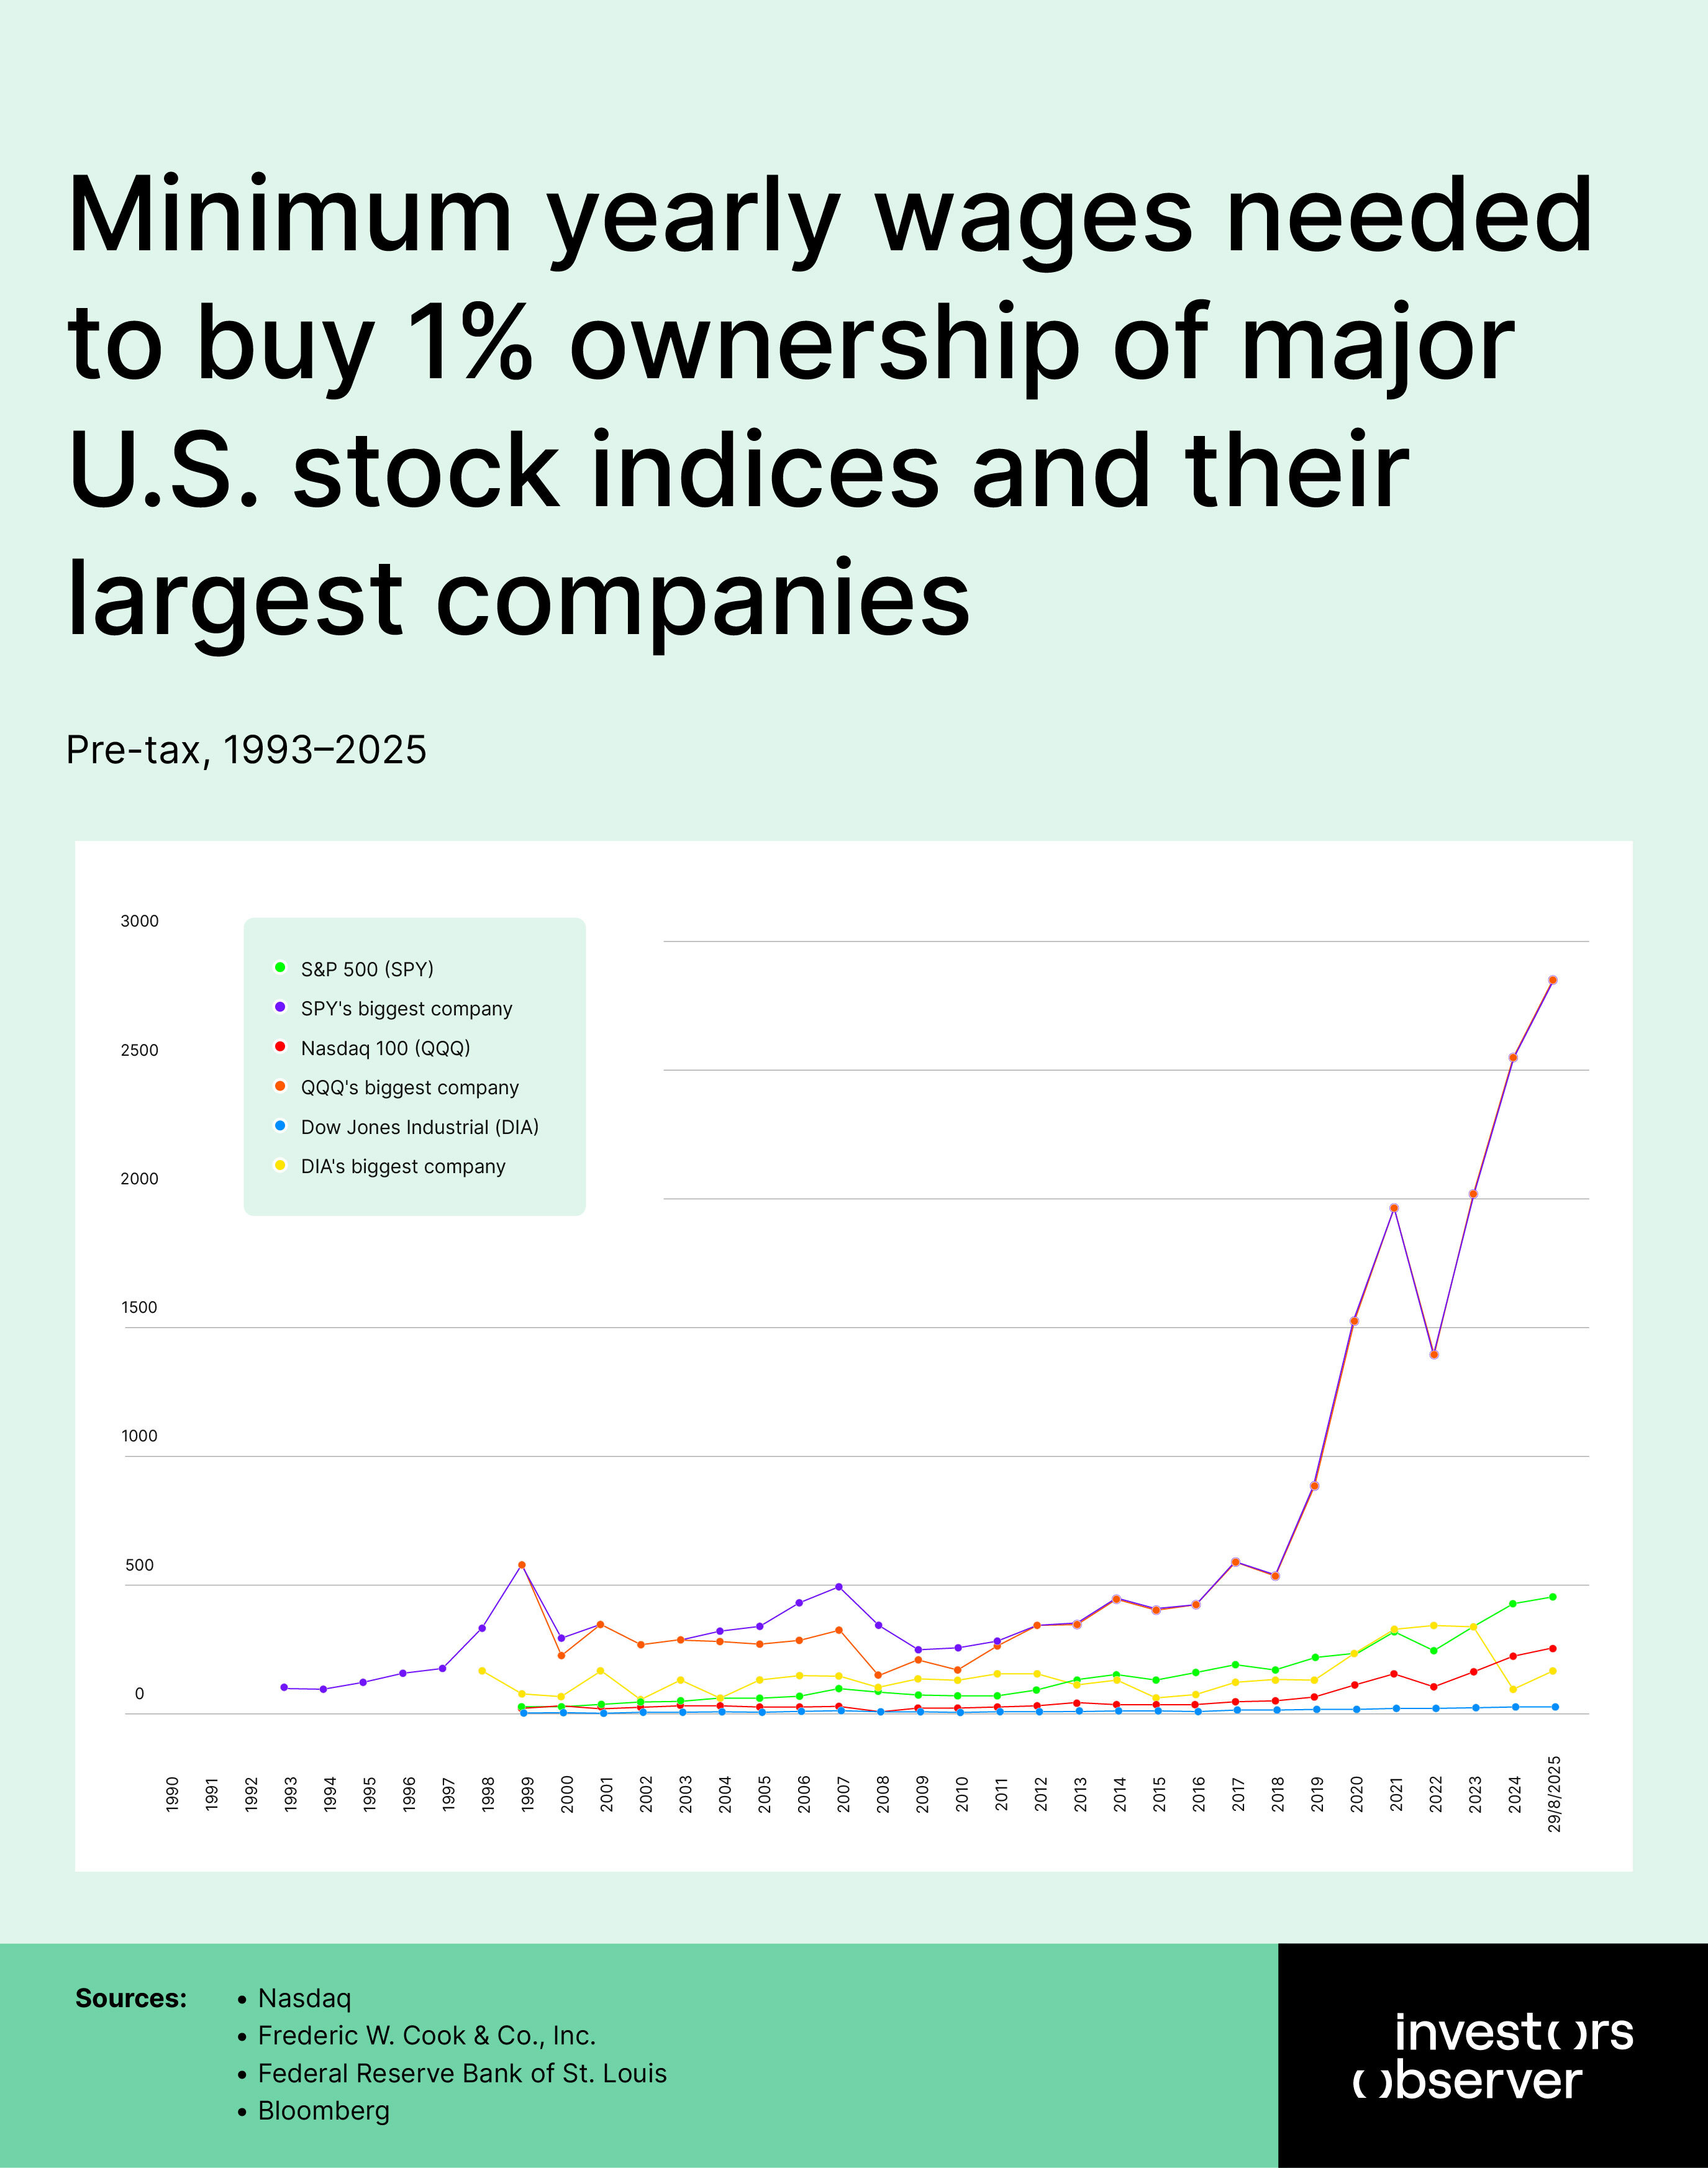
We used federal minimum wage rates and compared those yearly salaries to the prices of buying 1% shares of top companies and broad stock market funds.
The story this tells is simple but important: owning even a small piece of these companies requires an increasingly large number of minimum-wage salaries.
This change reflects not just the growth of these companies but the slow rise of minimum wages compared to market values.
In short, for many, the idea of buying significant stock in America’s largest corporations is moving farther out of reach.
Key findings
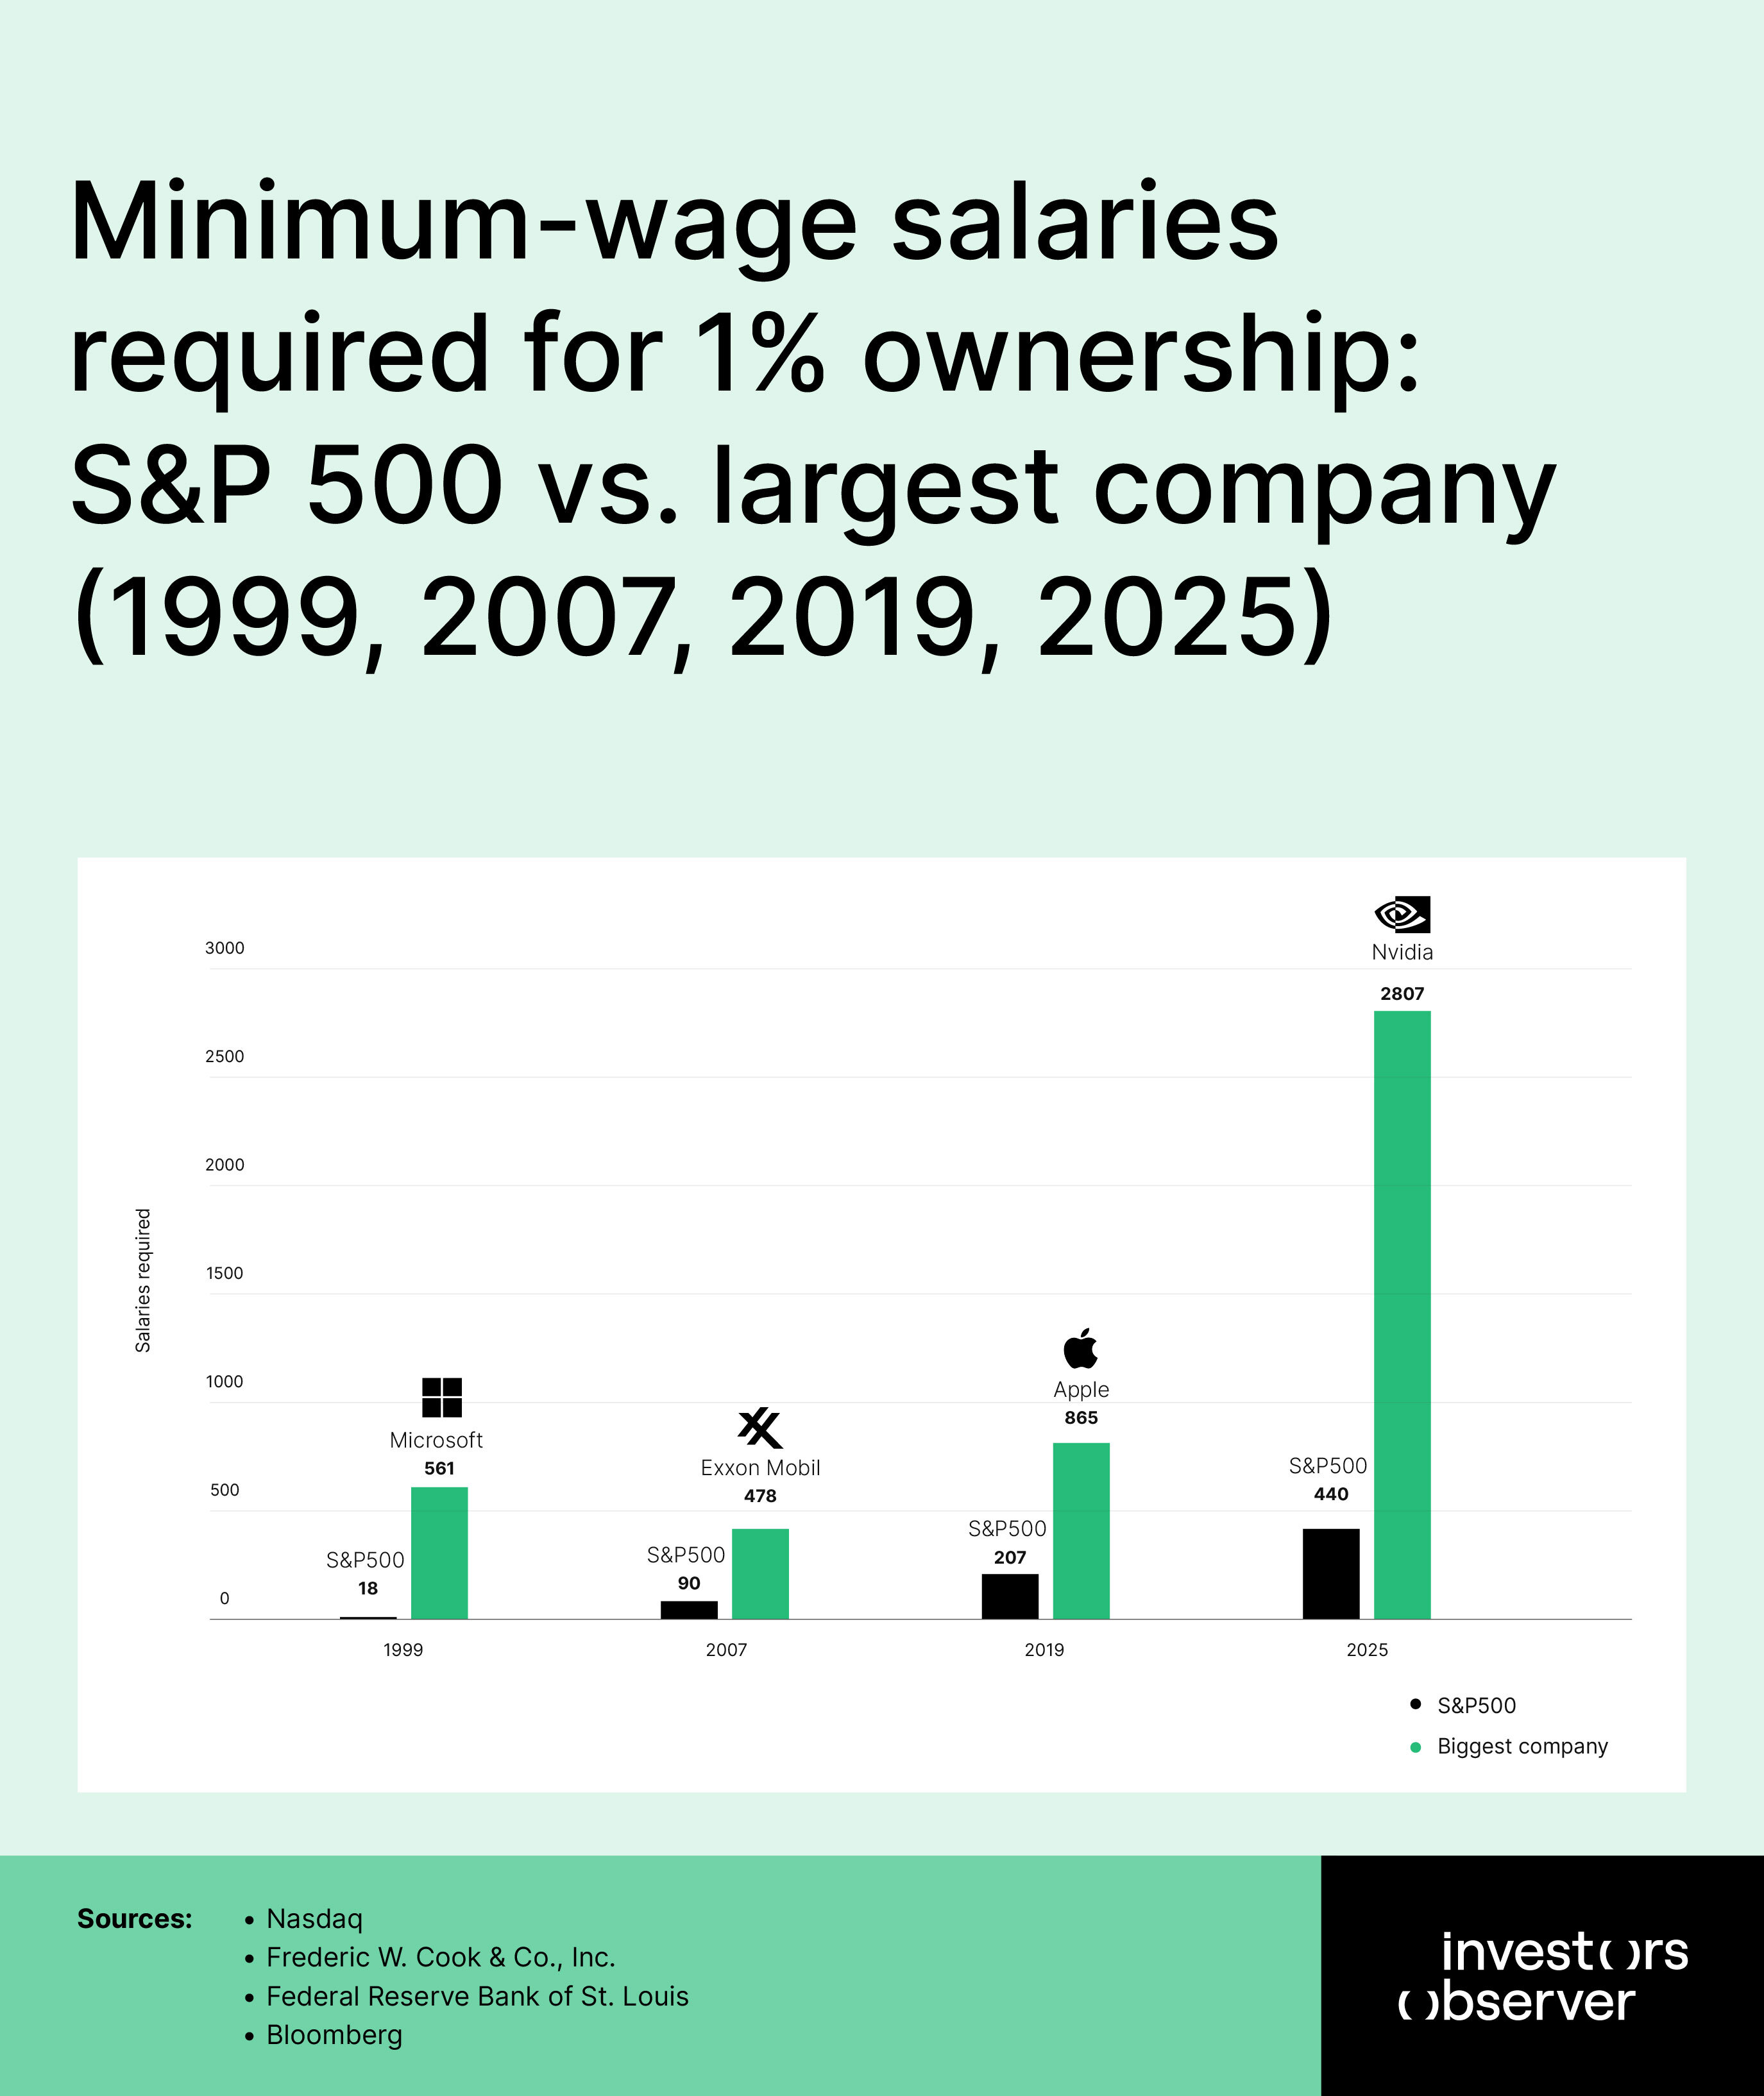
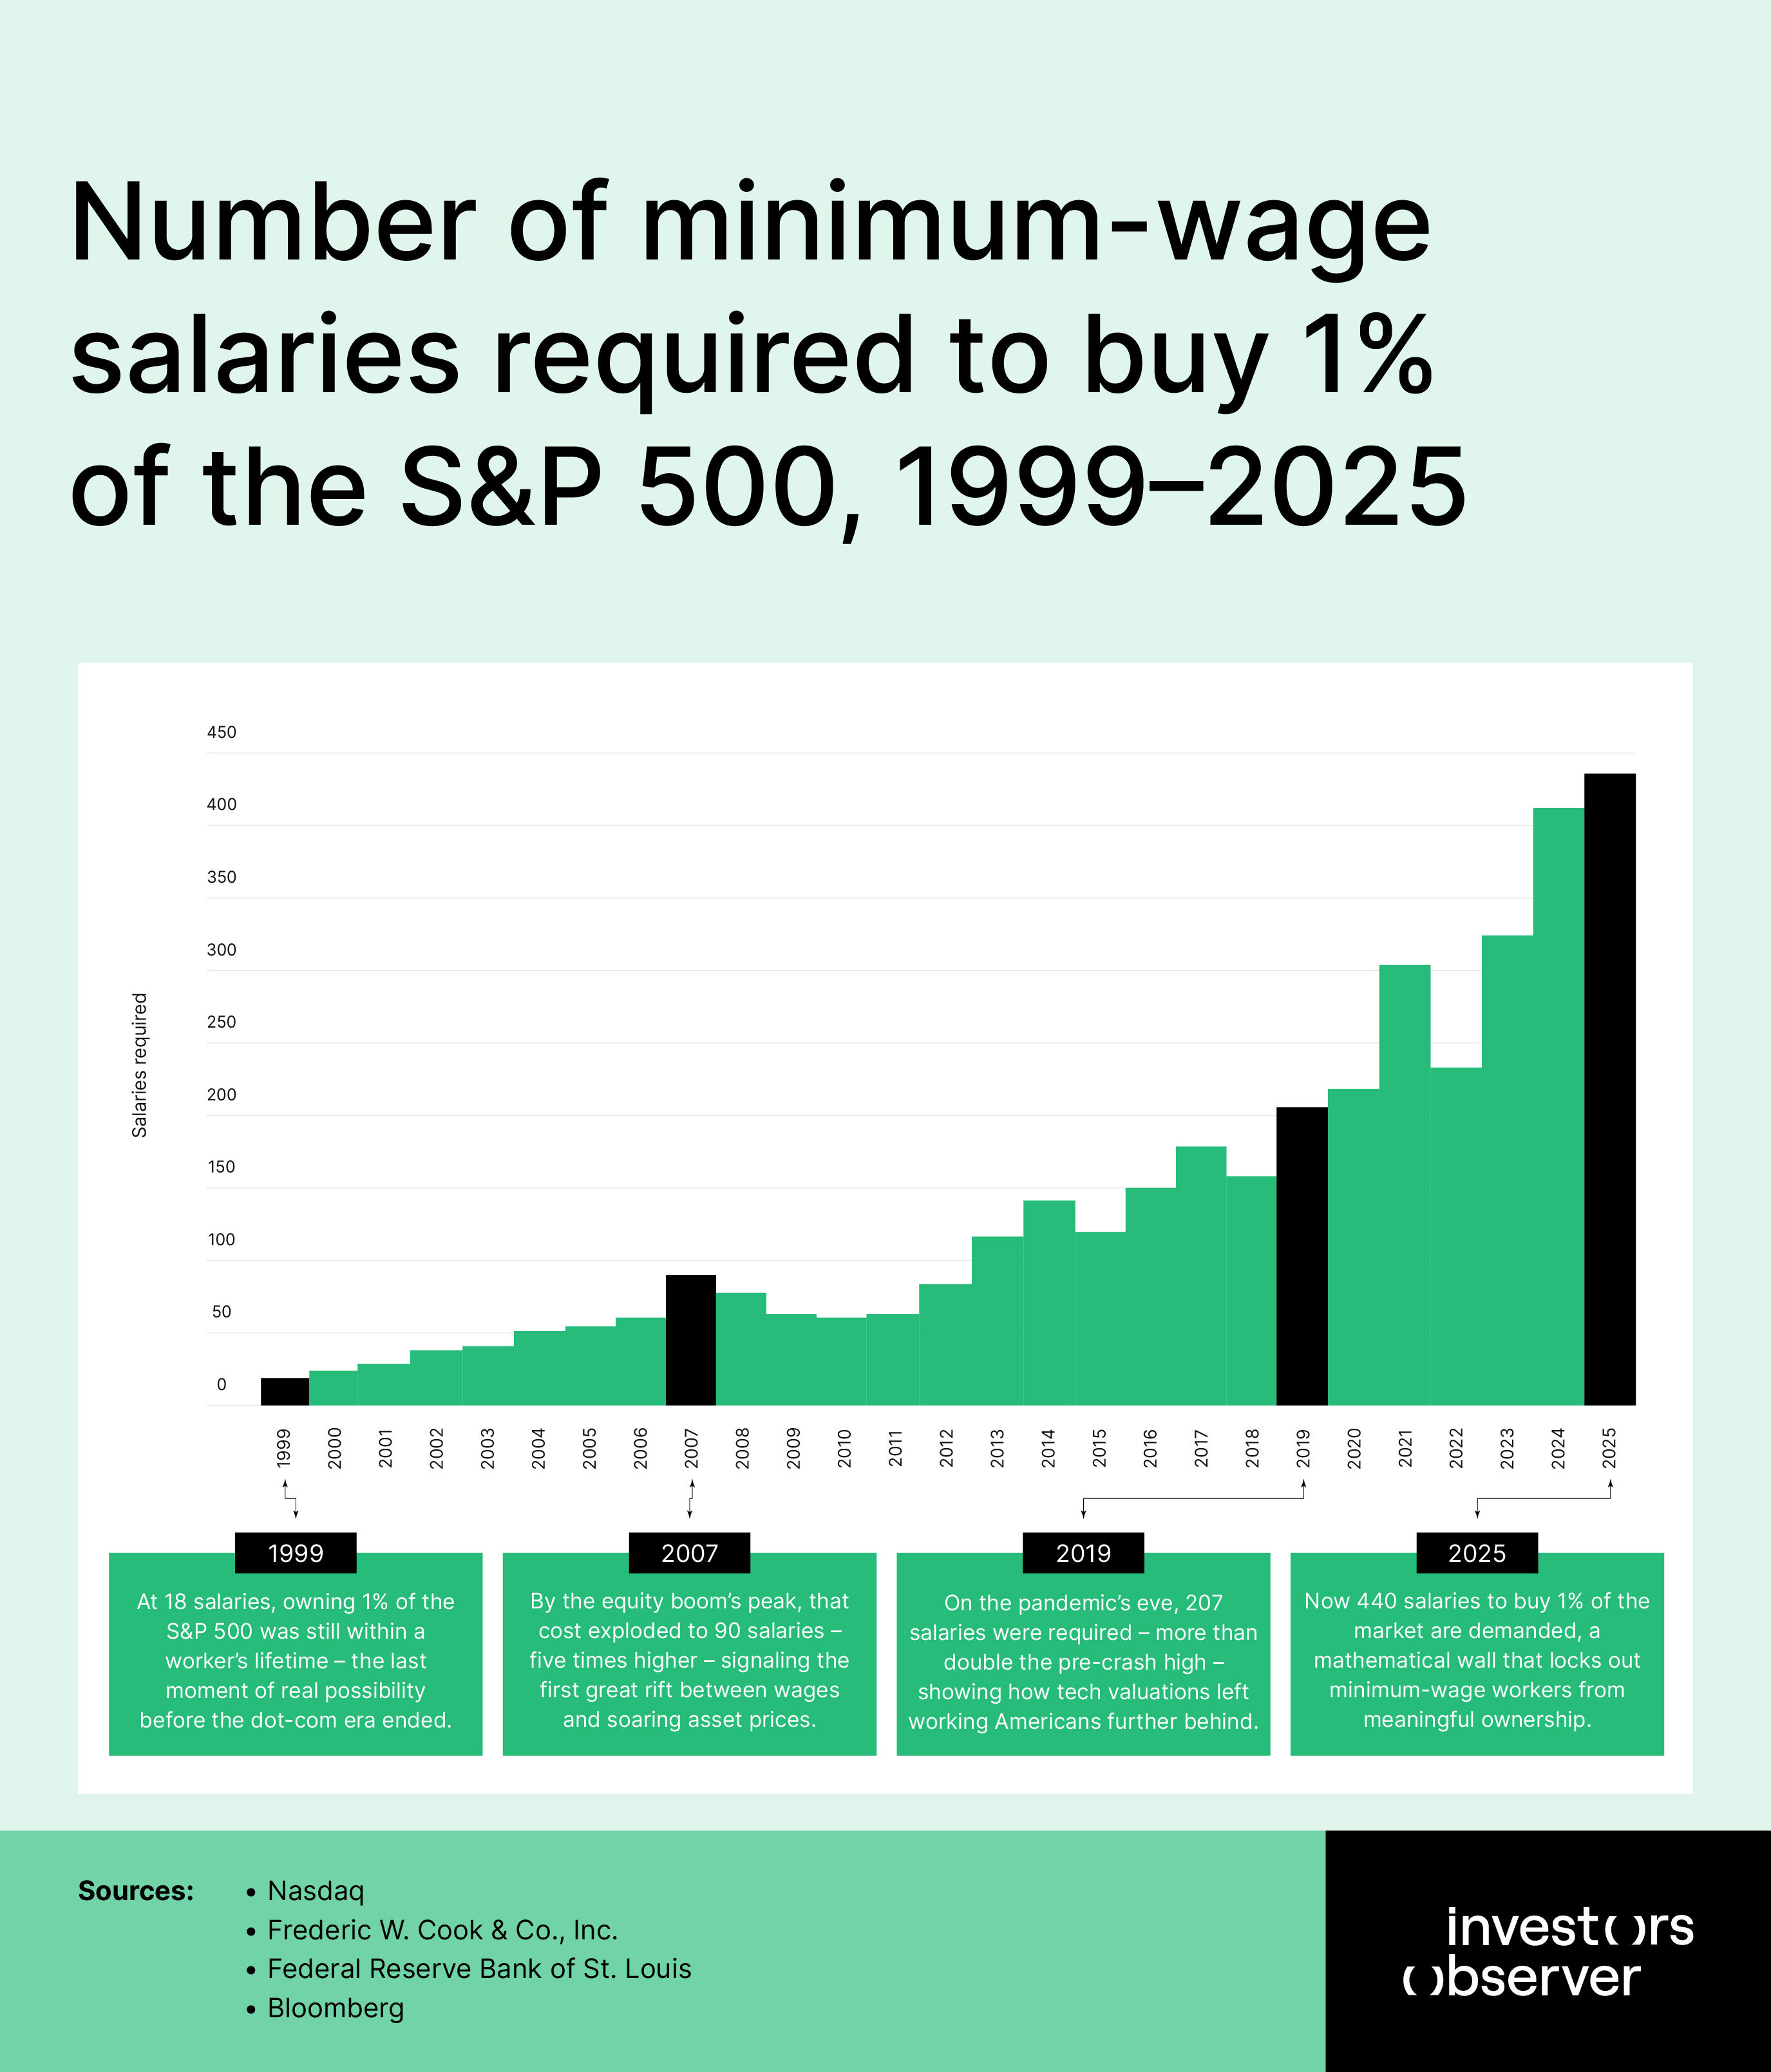
- Buying 1% of the S&P 500 required 18 minimum-wage salaries in 1999, and it requires 440 salaries in 2025.
- 1% ownership of the biggest company in 1999, Microsoft, required 561 minimum salaries.
- 1% ownership of the biggest company in 2025, Nvidia, requires 2,807 minimum wages – a twentyfold increase compared to 2010.
- Federal minimum wage increased 41% from 1999 to 2025 ($5.15 to $7.25), while stock valuations increased over 2,000%.
- Required salaries for 1% of the S&P 500 ownership increased from 18 (1999) to 90 (2007 peak) to 207 (2019) to 440 (2025).
The 1990s: when stock ownership seemed possible
The late 1990s represented the final moment when stock market participation felt achievable for minimum-wage workers. With the federal minimum wage at $5.15 per hour, a full-time worker earned $10,712 annually before taxes.
In 1999, purchasing one percent of the S&P 500 index fund required 18 yearly salaries – a substantial but not impossible goal for a dedicated saver.
Microsoft dominated the market with a valuation that required 561 minimum-wage salaries to purchase one percent of the company. While this number seems large in hindsight, it pales compared to today's requirements.
The technology boom was creating unprecedented wealth, but the scale remained comprehensible to ordinary Americans. A minimum-wage worker could conceptually imagine saving for decades to own a meaningful stake in America's most valuable company.
The Dow Jones Industrial Average presented the most accessible entry point, requiring just 1.2 yearly salaries to purchase one percent of the index. This accessibility reflected the Dow's price-weighted methodology and its focus on established industrial companies rather than high-growth technology stocks.
American Express, the Dow's largest position by market weight in 1999, represented old-economy stability that hadn't yet been overtaken by the digital revolution.
These 1990s numbers established a baseline that would soon prove to be the high-water mark of stock market accessibility. The dot-com boom was creating fortunes, but it hadn't yet completely severed the connection between wages and investment opportunity.
A minimum-wage worker willing to sacrifice and save could still harbor realistic dreams of meaningful stock ownership. This mathematical possibility would vanish in the decades to come, replaced by barriers that make such dreams effectively impossible.
The 2000s: the great divergence begins
The 2000s were the beginning of the great divergence between wages and stock ownership costs. Following the dot-com crash, Exxon Mobil emerged as the S&P 500's dominant company, reflecting America's energy-dependent economy.
The number of minimum-wage salaries needed to purchase 1% of the largest company fluctuated dramatically, ranging from 238 salaries in 2009 to 478 salaries in 2007, as oil prices and market volatility created wild swings in corporate valuations.
More worrying was the trend in index fund ownership. By 2007, purchasing 1% of the S&P 500 required 90 yearly minimum-wage salaries – nearly five times the 1999 requirement.
The 2008 financial crisis provided temporary relief, dropping the requirement to 78 salaries, but this reprieve proved short-lived. The crisis revealed how quickly economic turbulence could make stock ownership either more accessible or more impossible, depending on market timing.
The federal minimum wage increased from $5.15 to $6.55 during this decade, a 27% rise that seemed meaningful in isolation. However, this wage growth was completely overwhelmed by the expansion in stock market valuations.
Even during the market's most accessible moment in 2009, following the financial crisis, a minimum-wage worker needed 63 yearly salaries to purchase one percent of the S&P 500 – more than three times the 1999 requirement.
The decade established a pattern of increasing inaccessibility punctuated by crisis-driven temporary reprieves. The reality was moving in the opposite direction, creating barriers that would only grow higher in subsequent decades.
2010s: prices soar for the biggest companies
During the 2010s, minimum wages remained roughly flat at about $15,080 per year. Despite stagnant wage growth, the cost in minimum wages to purchase 1% of the S&P 500 grew markedly, increasing from about 60 minimum wages in 2010 to nearly 207 by the end of the decade. This quadrupling shows how market capitalization soared while wages stagnated.
The largest companies in the index changed notably, with Apple rising to the top. The minimum wages required to buy 1% in these largest firms soared from roughly 245 in 2010 to an astonishing 865 by 2019.
The Nasdaq 100 mirrored this trend with the wages needed rising from 158 minimum wages at the beginning of the decade to also around 865 by 2019.
The Dow Jones Industrial Average, focused more on less tech-heavy stable companies, showed a steadier increase in affordability needs, going from around 121 minimum wages in 2010 to roughly 122 by the end of the decade.
This decade highlights that while minimum paychecks stayed stagnant, the growth in stock prices of the biggest companies exploded. For minimum wage earners, owning meaningful stock shares in these firms became much more difficult.
The data shows a widening gap between stock market values and wage growth, contributing to growing concerns about economic inequality and wealth accumulation concentrated in stocks.
2020s: the affordability gap widens
The 2020s have seen an unprecedented increase in the number of minimum wages required to buy 1% of America’s largest stocks. By 2025, it takes approximately 440 minimum wages to buy 1% of the S&P 500 ETF – more than 7 times the figure from 2010.
The required wages to buy 1% of the largest company, Nvidia, have hit 2,807 by 2025. This is a twentyfold increase compared to 2010 and shows how tech heavyweights have grown massively.
Minimum wages remaining stuck at approximately $15,080 yearly pre-tax further highlights this affordability gap. The Nasdaq 100’s largest firms have seen the minimum wages needed to buy 1% skyrocket alongside Nvidia’s rise.
Meanwhile, the Dow Jones’ minimum salary requirements to own 1% shares grew to about 155 wages by 2025, showing less dramatic growth but still a significant increase compared to previous decades.
The data clearly charts a growing disconnect: while market capitalization of the largest public companies quickly expands, minimum wages have barely moved.
For minimum wage workers, meaningful ownership of these companies is largely unattainable. The growing disparity suggests the need for policies that address wage growth and wealth inclusion, so more workers can share in America’s economic successes.
This decade’s data closes with a worrying reality: the stock market’s rise has outpaced minimum wages to the point where owning a piece of America’s biggest companies is beyond reach for many working Americans.
Implications: when a lifetime isn't long enough to buy in
This research exposes a fundamental breakdown in the social contract that has underpinned American capitalism for generations. The promise that hard work could lead to ownership in the companies driving economic growth has become mathematically impossible.
The growing barrier to ownership
When purchasing 1% of the S&P 500 requires nearly ten times a worker's entire career earnings, we are witnessing the systematic exclusion of working Americans from the wealth-building mechanisms that define modern prosperity.
The implications extend far beyond individual financial planning. In 1999, a minimum-wage worker dedicating 41% of their working lifetime to saving could theoretically own a meaningful stake in America's stock market.
Today, that same goal would require nearly 978% of a working lifetime – an impossibility that reveals how completely wages have been severed from wealth creation. This doesn’t concern financial literacy or personal responsibility – it’s about barriers that no individual effort can overcome.
What this means for workers
Consider what these numbers mean in human terms. A 22-year-old minimum-wage worker starting today would need to save every penny of their pre-tax earnings until they are 462 years old to purchase 1% of the S&P 500.
Factor in taxes, and that timeline extends to 550 years. For individual companies like Nvidia, the timeline stretches to 3,500 years after taxes – longer than recorded human history.
These numbers aren’t just statistics – they show a problem in America’s economic system. The system promised many people a fair chance to succeed and own a part of America’s biggest companies.
But now, that promise feels broken because owning even a small share requires hundreds or thousands of minimum wage salaries. This gap means regular workers are finding it harder and harder to share in the country’s wealth.
The policy choices behind wage stagnation
The wage stagnation at the heart of these calculations reflects deliberate policy choices that have prioritized corporate profits over worker compensation. While stock valuations have grown 56 times faster than wages since 1999, the federal minimum wage has remained frozen at $7.25 for 16 years.
This is the result of political decisions that have systematically transferred wealth from workers to asset holders. The mathematical impossibility of stock ownership for minimum-wage workers is both a symptom and cause of America's broader inequality crisis.
The threat to democratic capitalism
What do these trends mean for democratic capitalism itself? When the vast majority of Americans cannot afford to own stakes in the companies that employ them and shape their communities, economic power becomes concentrated in an increasingly narrow class of asset holders.
Stock ownership was once seen as a pathway to middle-class stability and a stake in America's economic future. Today's numbers suggest that pathway has been permanently closed to working Americans, replaced by a system that treats workers as costs to be minimized rather than stakeholders to be included.
A lost generation of investors
The generational implications are equally serious. Today's young workers face barriers that would have been inconceivable to previous generations. A system that requires 112 generations to achieve ownership in a single company has effectively abandoned any pretense of intergenerational mobility through investment.
These workers will spend their careers creating value for companies they can never hope to own, in an economy that has made shared prosperity a mathematical impossibility.
Structural change is needed
This research documents the transformation of American capitalism from a system of broad-based opportunity to one of concentrated wealth extraction. The numbers demand recognition that individual solutions cannot address structural problems of this magnitude.
When such barriers make the American Dream impossible rather than merely difficult, the response must be equally transformative – policy interventions that reconnect work with wealth and restore the possibility of shared prosperity to American economic life.
Methodology
This research draws from a comprehensive dataset spanning 1990 to 2025, combining federal wage data with stock market capitalizations to calculate the number of minimum-wage salaries required to purchase ownership stakes in America's largest companies and market indices.
Wage data
Minimum wage rates were sourced from the Federal Fair Labor Standards Act records maintained by the federal government. Annual earnings were calculated by multiplying the federal minimum wage by 2,080 hours (40 hours per week for 52 weeks). All salary figures represent pre-tax income, providing a conservative baseline that understates the actual burden when taxes are considered.
Stock market data
The research tracks three major market indices through their corresponding exchange-traded funds to ensure accuracy. For the S&P 500, the study uses the SPY ETF, which directly tracks the index's market capitalization. The Nasdaq 100 is represented by the QQQ ETF, and the Dow Jones Industrial Average by the DIA ETF. All market capitalizations were recorded as of the last trading day of each calendar year and are expressed in thousands of dollars for calculation precision.
Company selection
The largest companies in each index were identified using different methodologies that reflect how each index is constructed. For the S&P 500 and Nasdaq 100, the largest company was determined by market capitalization, representing the total dollar value of all outstanding shares.
For the Dow Jones Industrial Average, the largest position was determined by stock price, reflecting the index's unique price-weighted methodology where higher-priced stocks carry greater weight regardless of company size.
Calculation method
The core metric – number of minimum-wage salaries needed to purchase 1% of a company or index – was calculated by dividing 1% of the total market capitalization by the annual minimum wage income. This approach provides a standardized measure of ownership accessibility that accounts for both wage levels and asset valuations over time.
Limitations
The analysis uses federal minimum wage rates, which may understate earning potential in states with higher minimum wages. All calculations assume full-time employment and do not account for taxes, benefits, or other deductions that would reduce available income for investment.
The focus on 1% ownership stakes, while providing a consistent comparative measure, represents a threshold that may seem arbitrary but offers insight into meaningful ownership participation versus token shareholding.
Sources
- Nasdaq
- Frederic W. Cook & Co., Inc.
- Federal Reserve Bank of St. Louis
- Bloomberg
Your email address will not be published. Required fields are markedmarked