
What does it really mean to “get ahead” financially in America? Most of the time, people measure progress by how much their paycheck grows year after year, or whether the median salary in their state keeps climbing. But when money loses value, those numbers are only part of the story.
InvestorsObserver’s research team has conducted research of gold-adjusted wages across all 50 U.S. states from 1998 to 2025 (October), analyzing how the purchasing power of American paychecks measured in ounces of gold has evolved over nearly three decades.
What they have found is discouraging: when measured against gold, one of history's most enduring stores of value, American wages have suffered a catastrophic 70% decline in real purchasing power over the past quarter-century.
The findings highlight why rising pay may often feel like it’s running in place, and why today’s paychecks sometimes seem to “buy less,” no matter their size. This research unpacks how Americans lost real ground in every state, decade by decade.
Key findings
- As of October 2025, American wages have lost 77% of their purchasing power against gold since 1998.
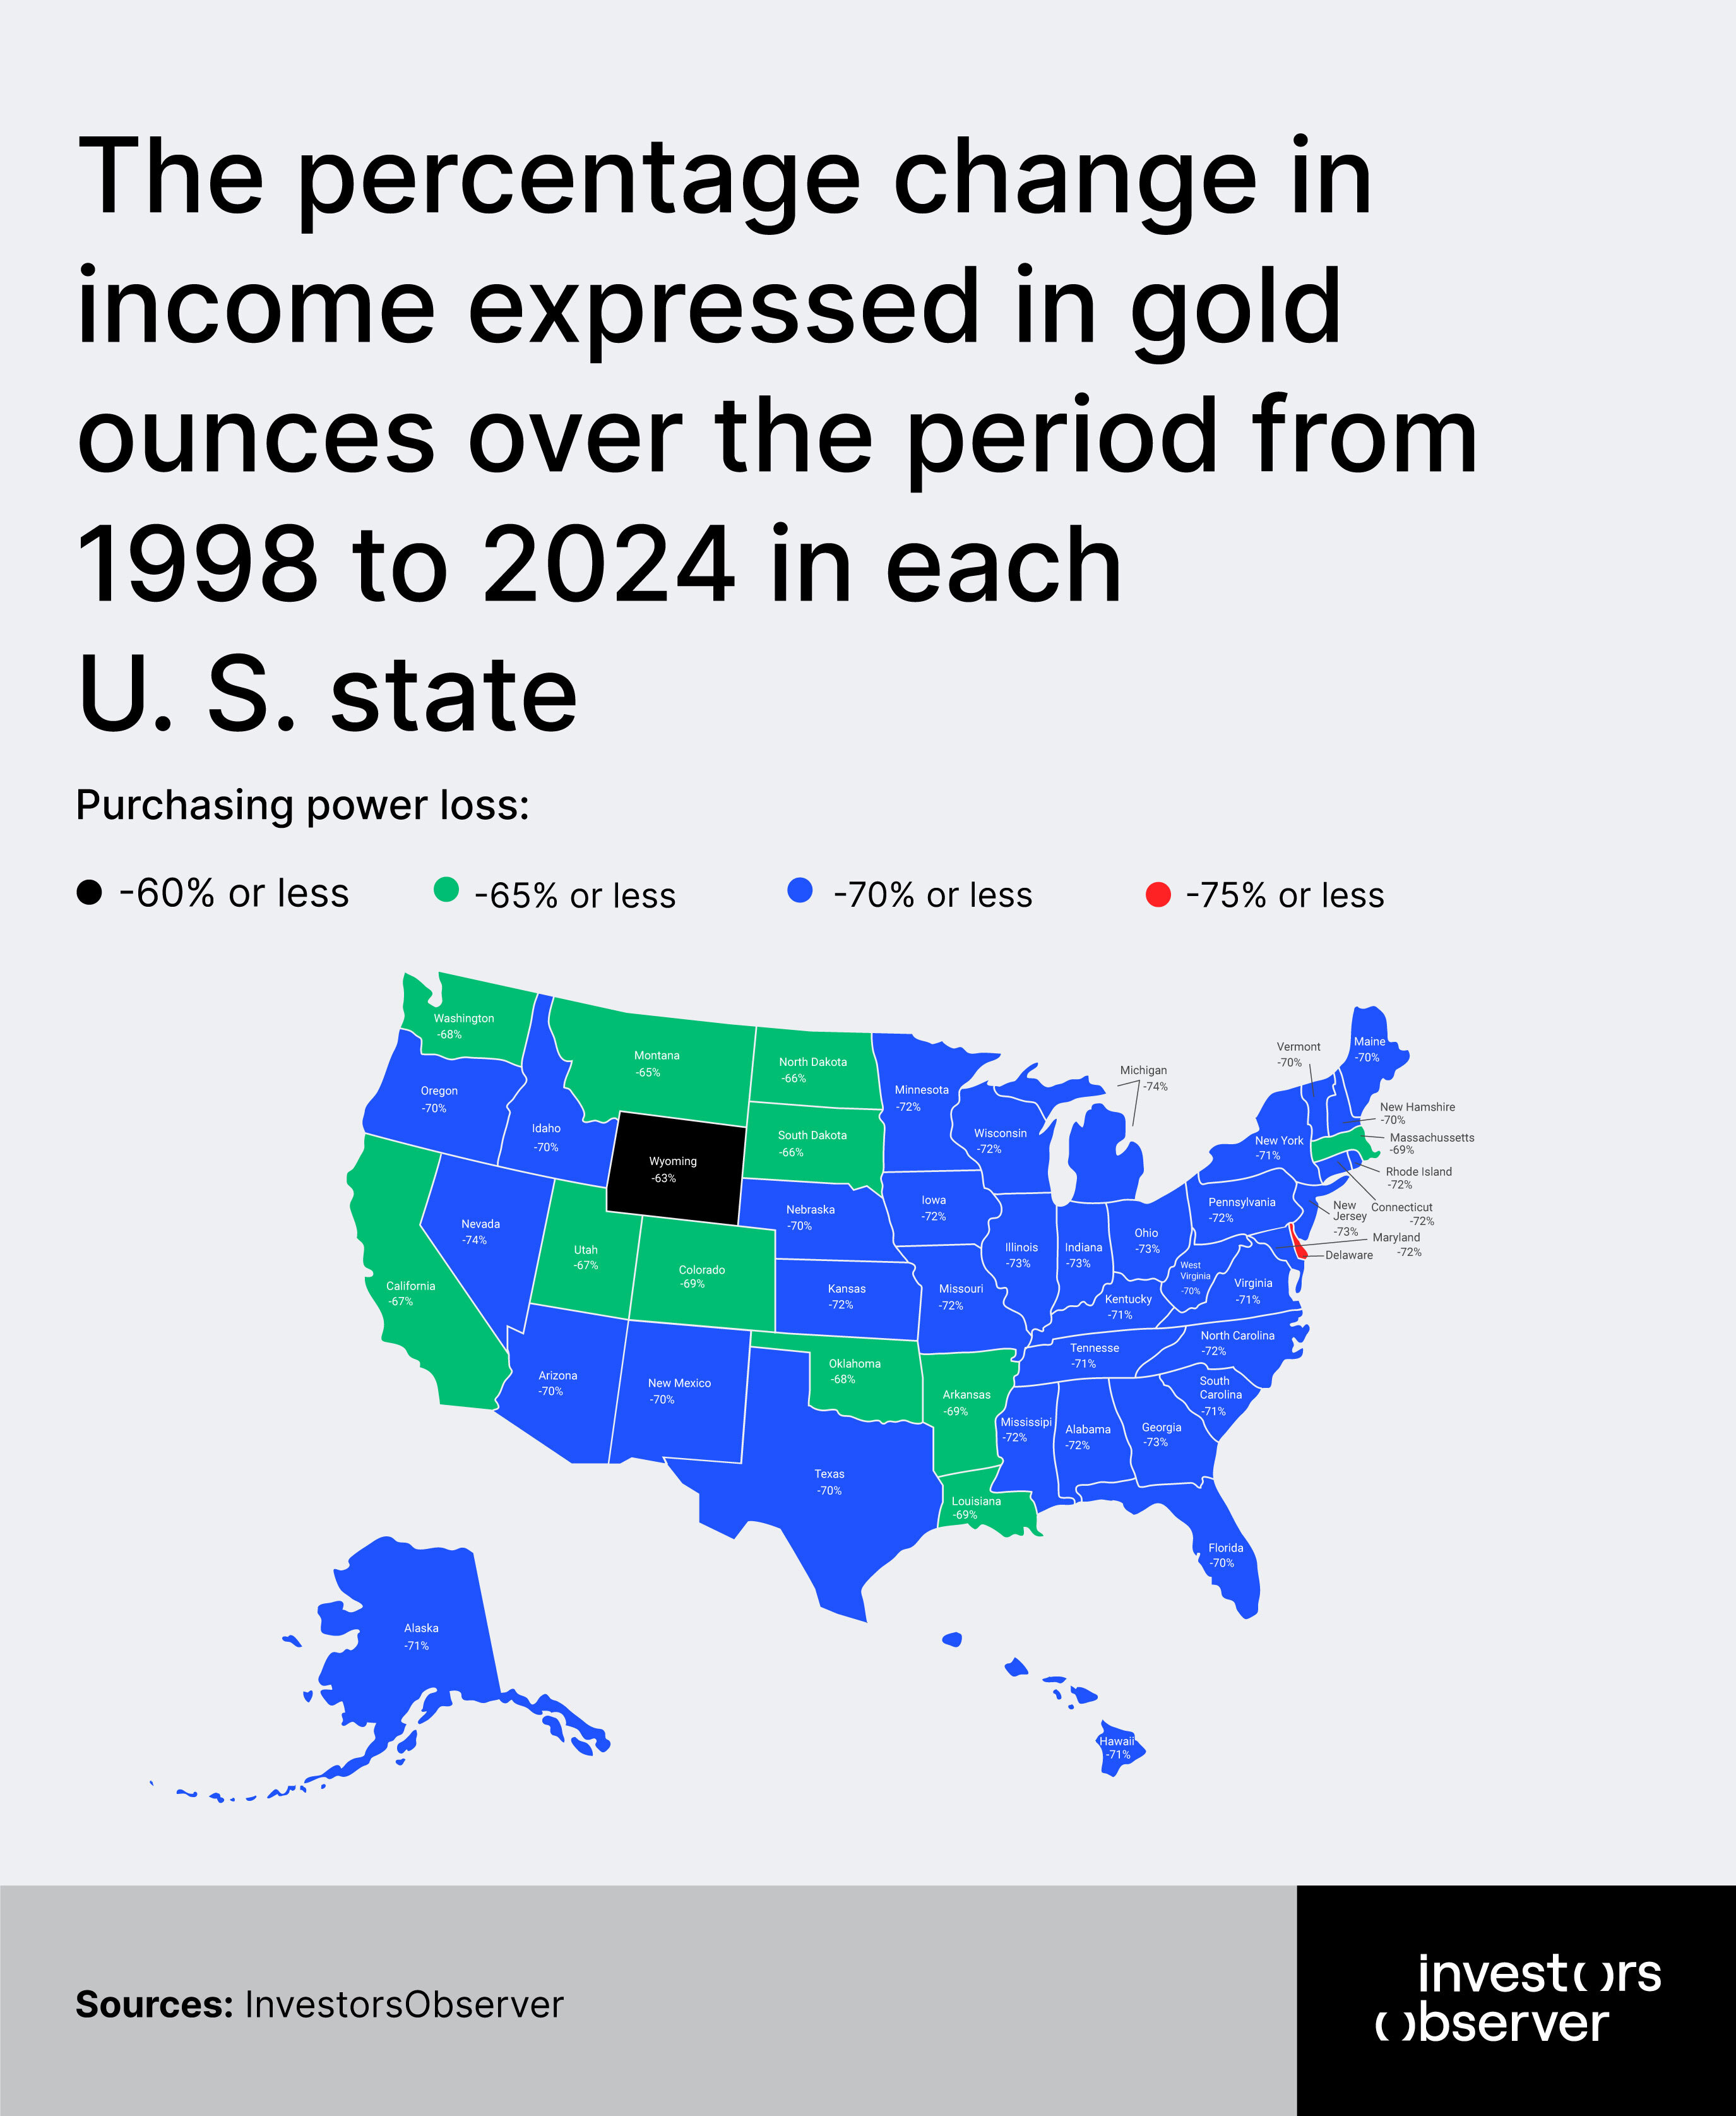
- The average American’s per capita income, measured in gold ounces, declined by roughly 70% from 1998 to 2024 – even as dollar salaries steadily rose.
- Between 2024 and October 2025, purchasing power in terms of gold has declined by an additional 20%.
- By 2007, only 14 states maintained gold-adjusted wages above 50, compared to 26 states that had achieved this level in 2000.
- By 2012, gold prices spiked to about $1,675/oz, and Americans’ gold-adjusted income hit a 26-year low – this was a moment when even the most prosperous states could barely achieve compensation levels that had been considered poverty-level just fifteen years earlier.
- Since 2020, gold surged again (over 70%), outpacing income growth (about 32%), pushing Americans’ gold-adjusted wages to new lows in most states by 2024.
The late 1990s: when work still paid
This research captures what now appears to be the twilight of American wage strength, a brief golden period when workers across the nation enjoyed robust purchasing power that would soon vanish forever. The late 1990s represented a genuine wealth-building potential for working families who could still transform modest paychecks into lasting stores of value.
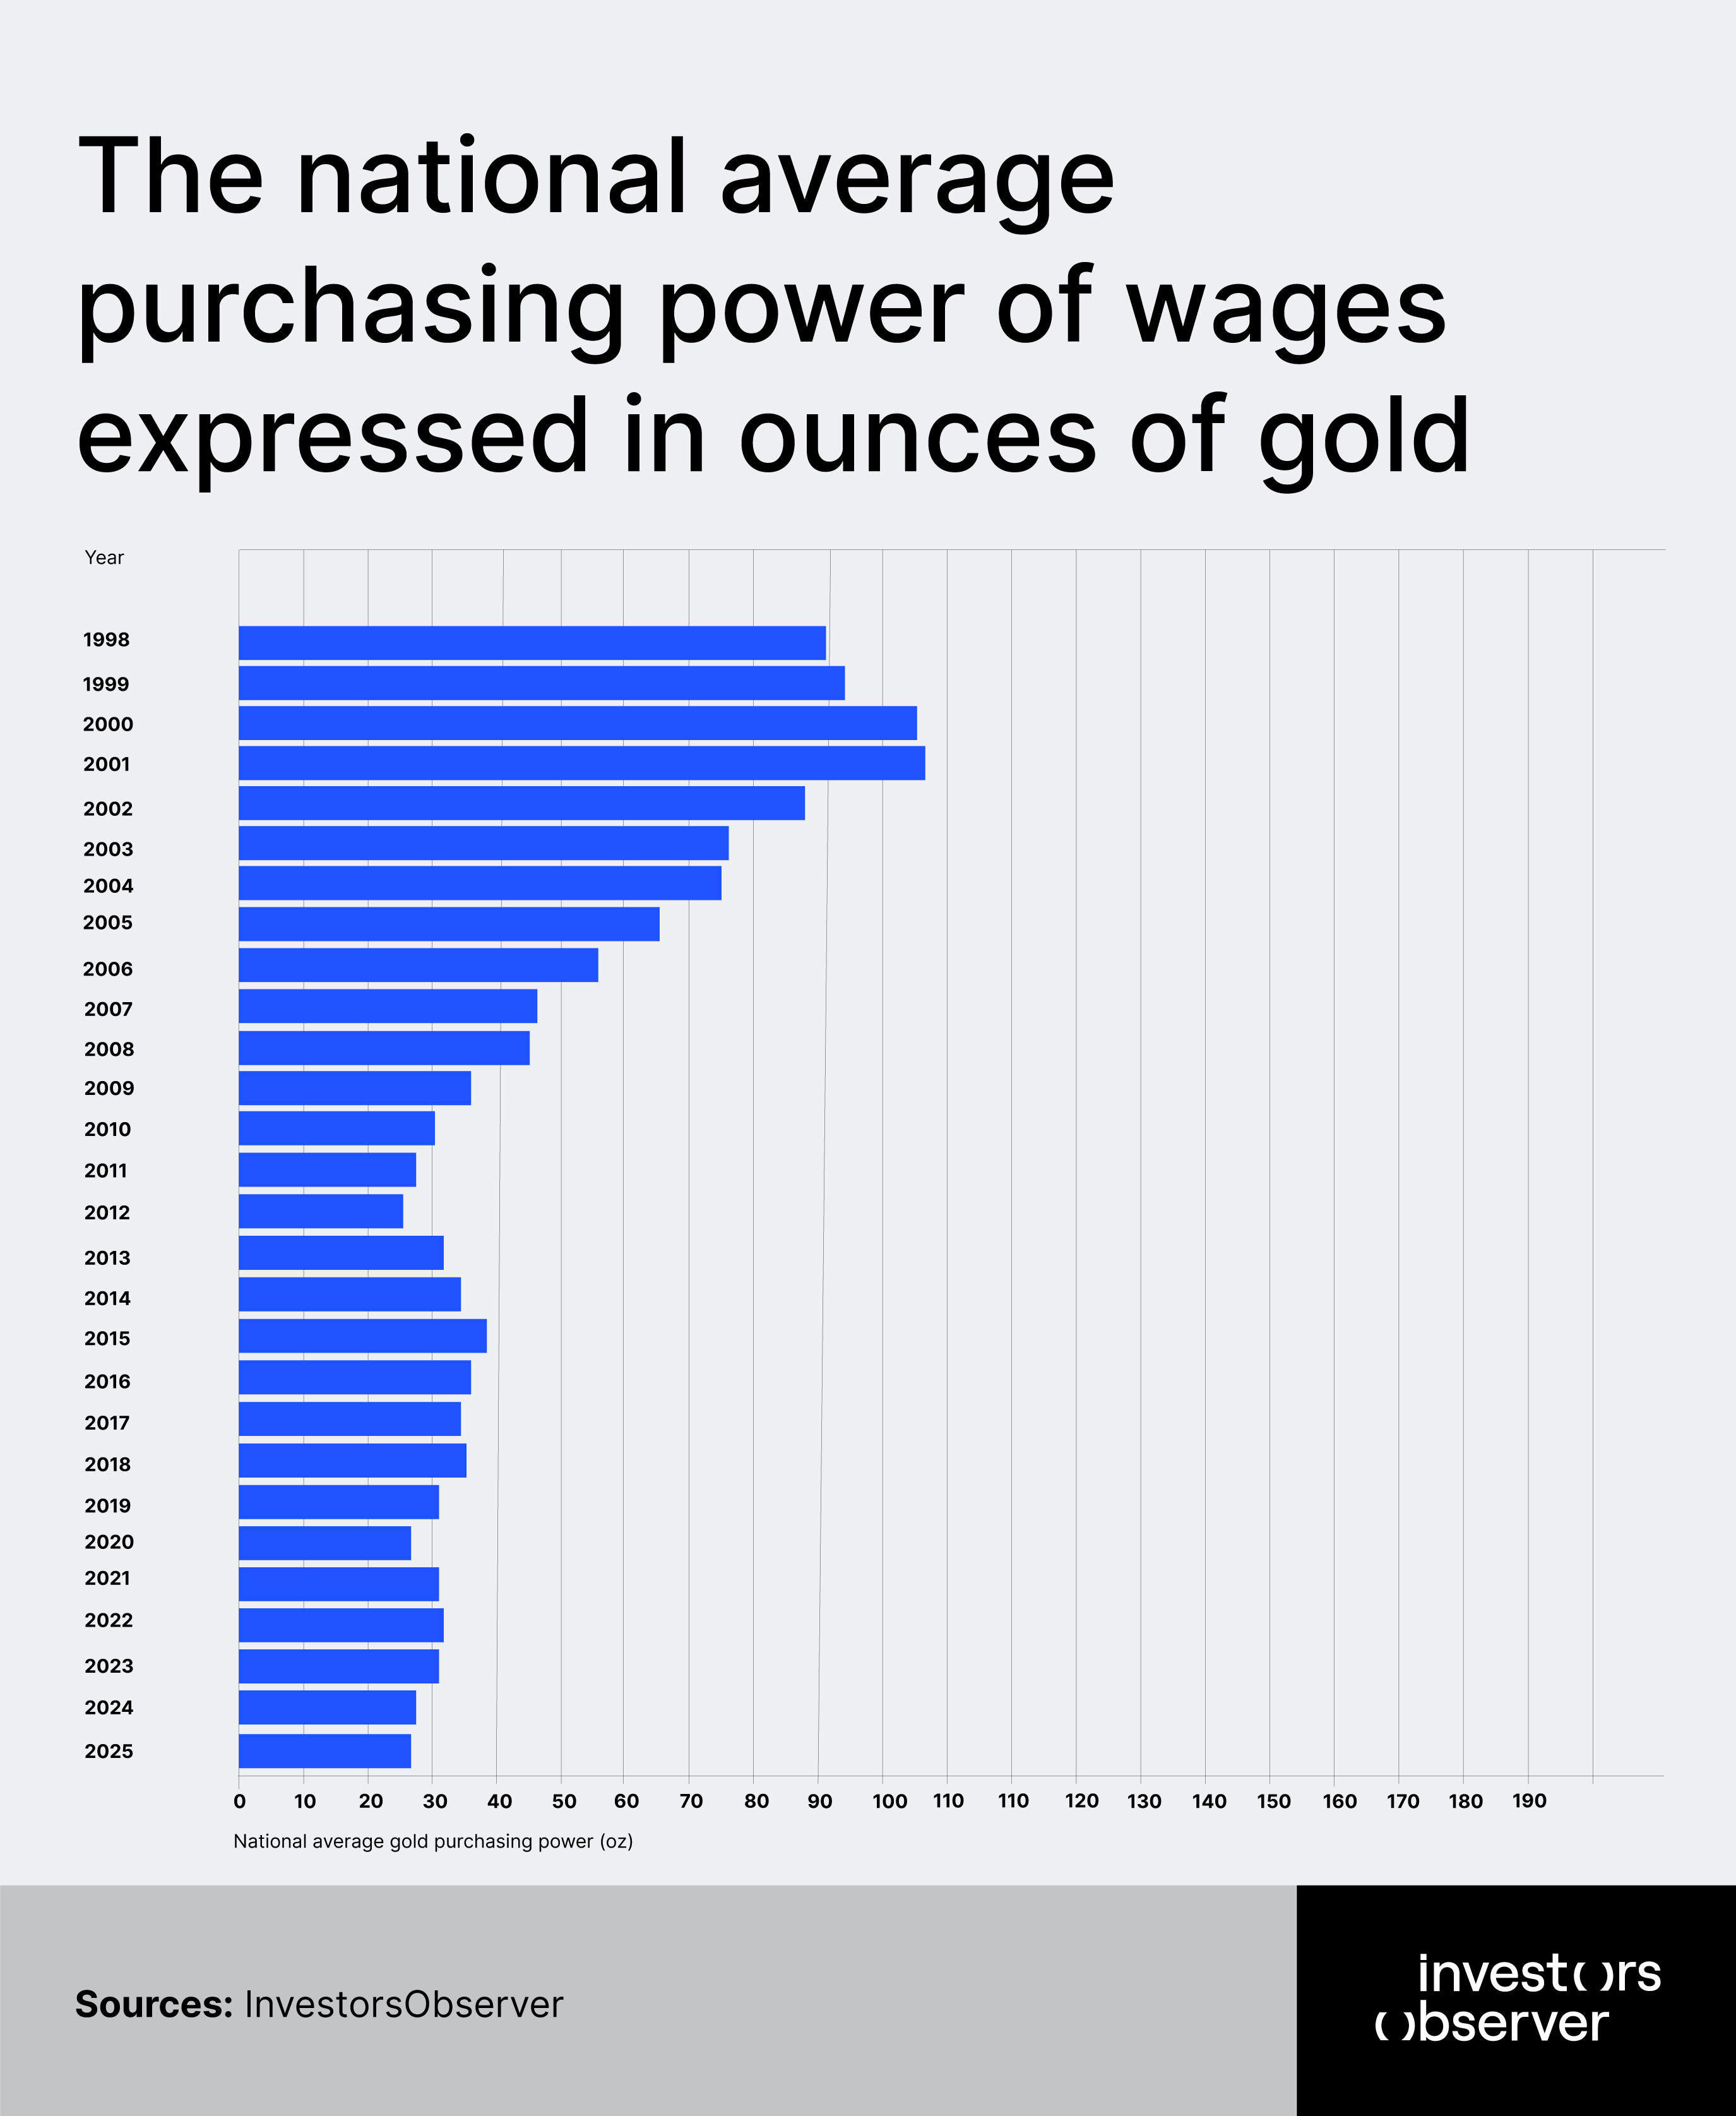
In 1998, American workers inhabited an economic environment vastly different from today's reality. The national average for gold-adjusted wages was 91.49, with a median state value of 90.6 – figures that seem almost mythical by contemporary standards.
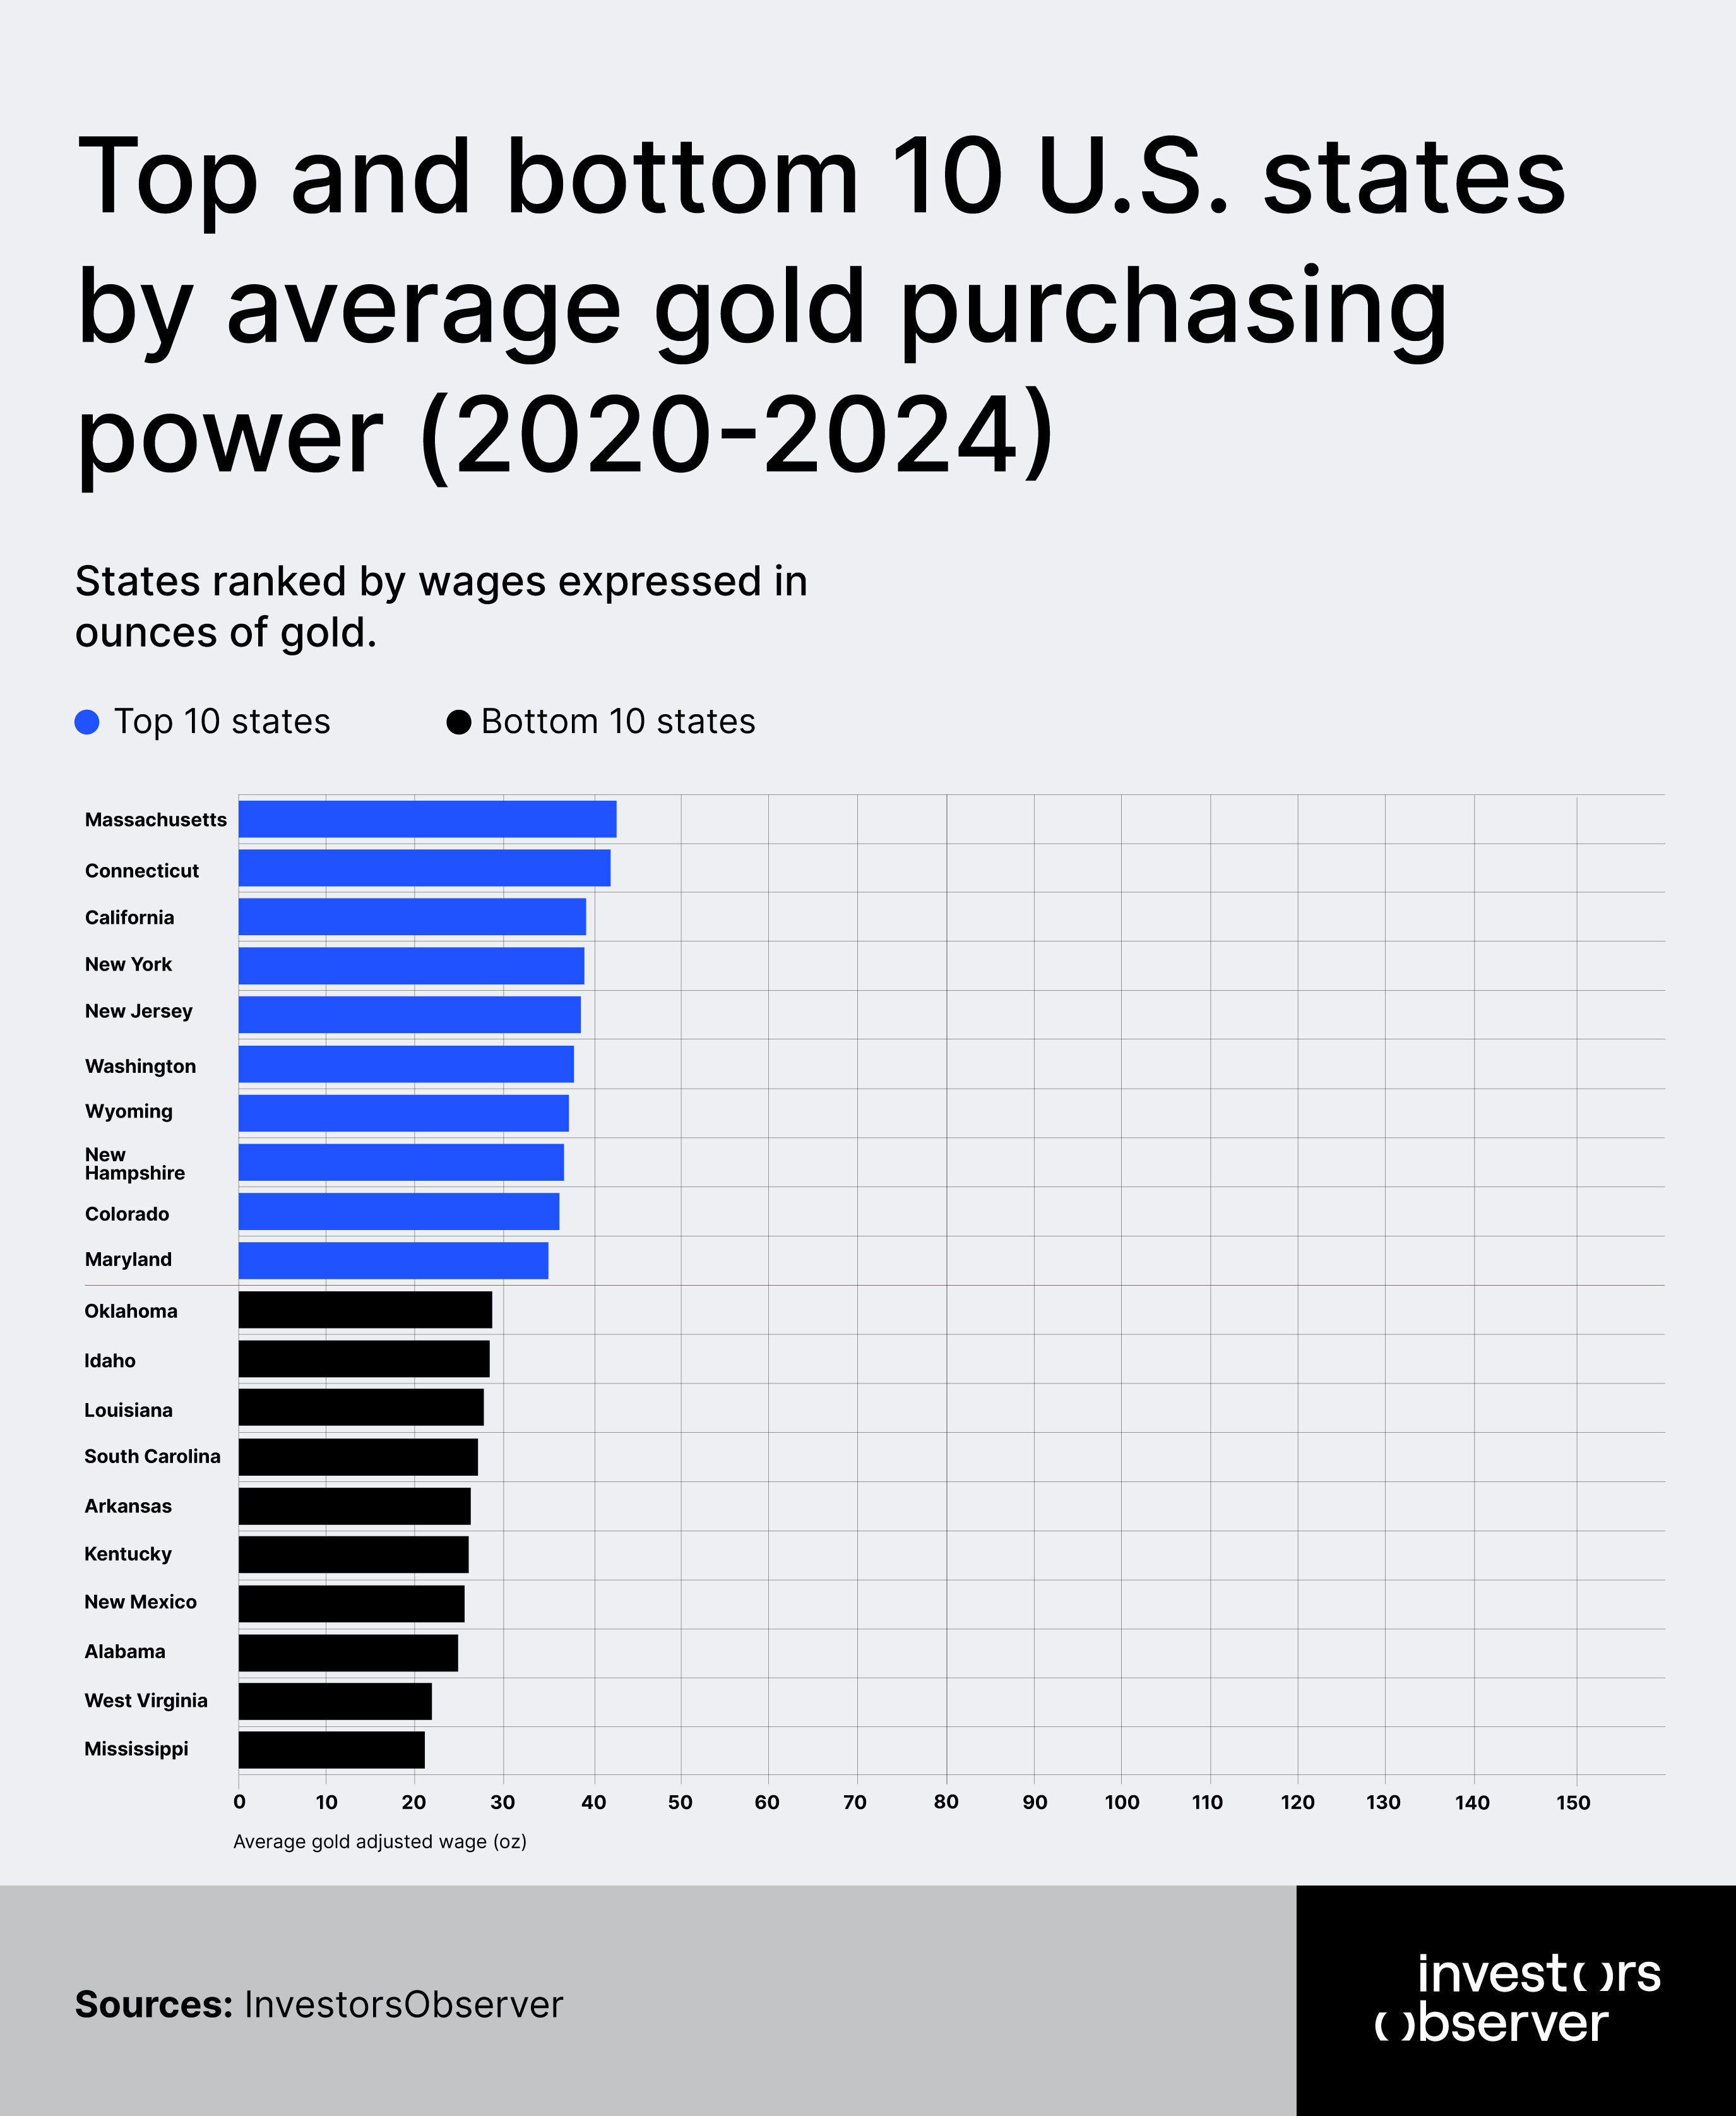
This wasn't merely about high earners in wealthy enclaves. Even workers in traditionally low-wage states enjoyed purchasing power that would be considered exceptional today. Mississippi, perennially America's poorest state, recorded gold-adjusted wages of 70.0 in 1998 – more than double what the typical American state achieves in 2024.
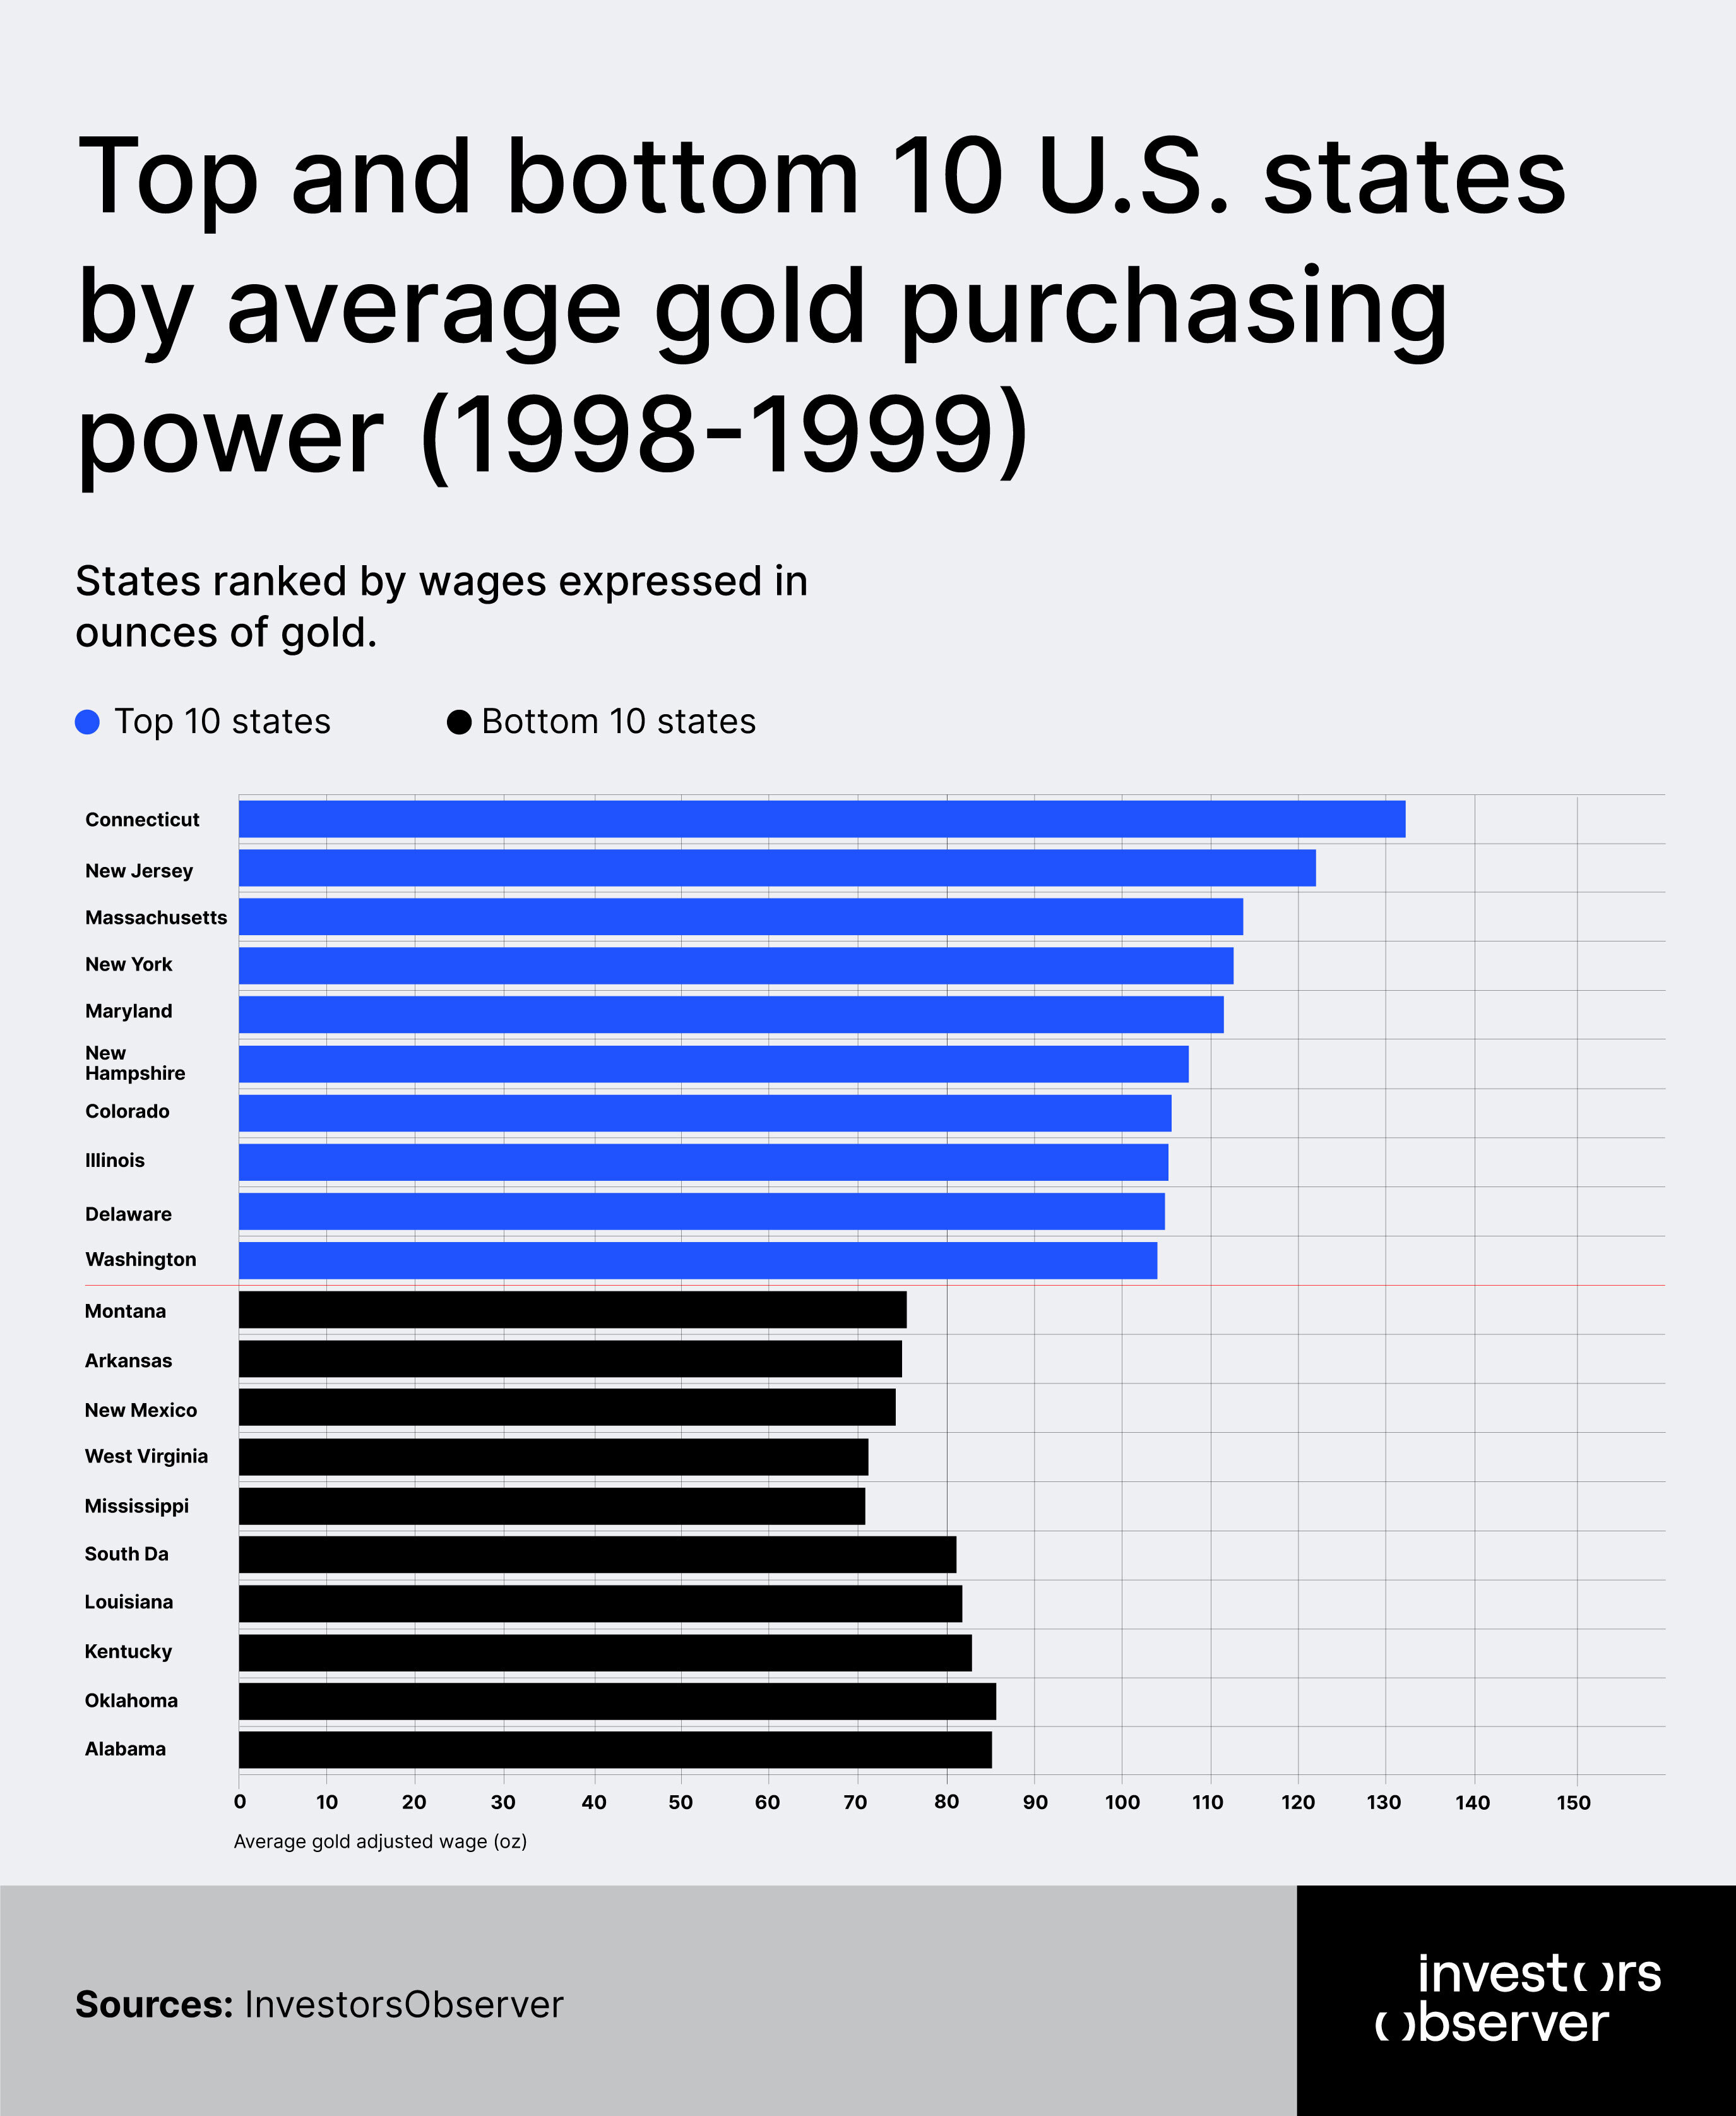
The prosperity wasn't evenly distributed, but the disparities were manageable and the overall trend was upward. Connecticut with 133.83 and New Jersey with 122.23 wage in ounces represented the peak of American wage purchasing power.
These weren't isolated anomalies but part of a broader pattern where financial centers, technology hubs, and knowledge economy regions commanded premium compensation that genuinely translated into wealth accumulation potential.
The top of the list was also dominated by Massachusetts (117.20), New York (113.90), and Maryland (111.70). This formed a powerful area of worker prosperity. These states represented not just high nominal wages but purchasing power that could withstand monetary pressures and asset price inflation.
A Connecticut worker earning gold-adjusted wages of 133.83 possessed real financial security, able to convert labor into tangible wealth stores at levels unimaginable for today's workers.
Yet even the bottom tier tells a story of relative prosperity. Montana workers, despite ranking the lowest nationally at 74.89, still enjoyed gold-adjusted wages that exceeded what most states can achieve today.
Arkansas workers at 74.70, New Mexico at 74.34, and West Virginia at 71.96 all participated in an economy where labor compensation maintained meaningful purchasing power against hard assets. These numbers meant families could realistically expect their work to provide genuine financial security.
The geographic distribution reveals a more balanced economy than exists today. Roughly 29% of states achieved gold-adjusted wages above 100, while another 18% fell between 90-100.
Only 22% of states registered below 80 – a far cry from today's universal struggle. Energy-producing states like Wyoming (89.2) and Alaska (101.6) enjoyed solid middle-tier performance, while technology centers like California (100.3) and Washington (101.8) demonstrated the emerging knowledge economy's wage premiums.
The period from 1998 to 1999 captured American workers at their last moment of collective advancement. The national average rose from 92.3 to 95.8 – a 3.7% improvement that would prove to be the final surge before decades of decline. This wasn't inflation-driven nominal growth. These were real gains in purchasing power that strengthened workers' financial positions relative to asset prices.
The improvement patterns reveal the economy's final healthy dynamics. Financial centers led the charge, with Massachusetts posting a robust 6.2% gain (113.7 to 120.7) and Delaware jumping 5.8% (102.1 to 108.1).
Technology hubs kept pace, with California advancing 5.7% (100.3 to 106.0) and Washington climbing 5.0% (101.8 to 106.9). Even resource-dependent Wyoming managed a 6.7% improvement (89.2 to 95.2), demonstrating broad-based wage strength across different economic sectors.
The consistency of improvement across regions revealed the economy's fundamental health. Financial centers averaged 5.2% gains, technology hubs advanced 5.1%, and even traditional manufacturing states in the Midwest posted respectable 3.5% improvements.
This wasn't a narrow boom benefiting only coastal elites. It represented the last period when American workers across geographic and economic divides could expect their purchasing power to strengthen over time.
Even the laggards performed respectably by today's standards. New Mexico's modest 1.0% improvement still meant workers earning 74.7 gold-adjusted wages – nearly triple what most states achieve today.
Montana's 1.5% gain brought workers to 75.4, while North Dakota's 1.8% increase reached 82.2. These "underperforming" states of the late 1990s would rank among today's most prosperous by gold-adjusted wage standards.
The wealth gap, while present, remained within reasonable bounds. The ratio between highest-performing Connecticut (137 in 1999) and lowest-performing Mississippi (72) was 1.9:1 – significant but not insurmountable. This gap would later explode as monetary policies and economic structural changes disproportionately benefited asset holders while devastating wage purchasing power.
These final years of the 1990s represented American workers' last stand before the great devaluation began. Families could still reasonably expect their paychecks to provide genuine wealth-building opportunities, regardless of whether they lived in Connecticut's affluent suburbs or Mississippi's rural communities.
The systematic destruction of this purchasing power over the following decades would prove to be one of the most consequential economic shifts in American history, transforming a nation of workers with real financial security into one where even modest asset accumulation requires extraordinary effort.
The 2000s: the decade that broke American workers
The new millennium began with deceptive promise for American workers, as gold-adjusted wages reached their historical zenith in 2001 at 108.51 nationally. This peak represented the final moment when American labor commanded genuine purchasing power against hard assets, with workers in affluent states like Connecticut earning gold-adjusted wages of 161.4 – levels that now seem almost fantastical.
But this prosperity proved to be a cruel mirage, masking the beginning of the most devastating collapse in American wage purchasing power in modern history.
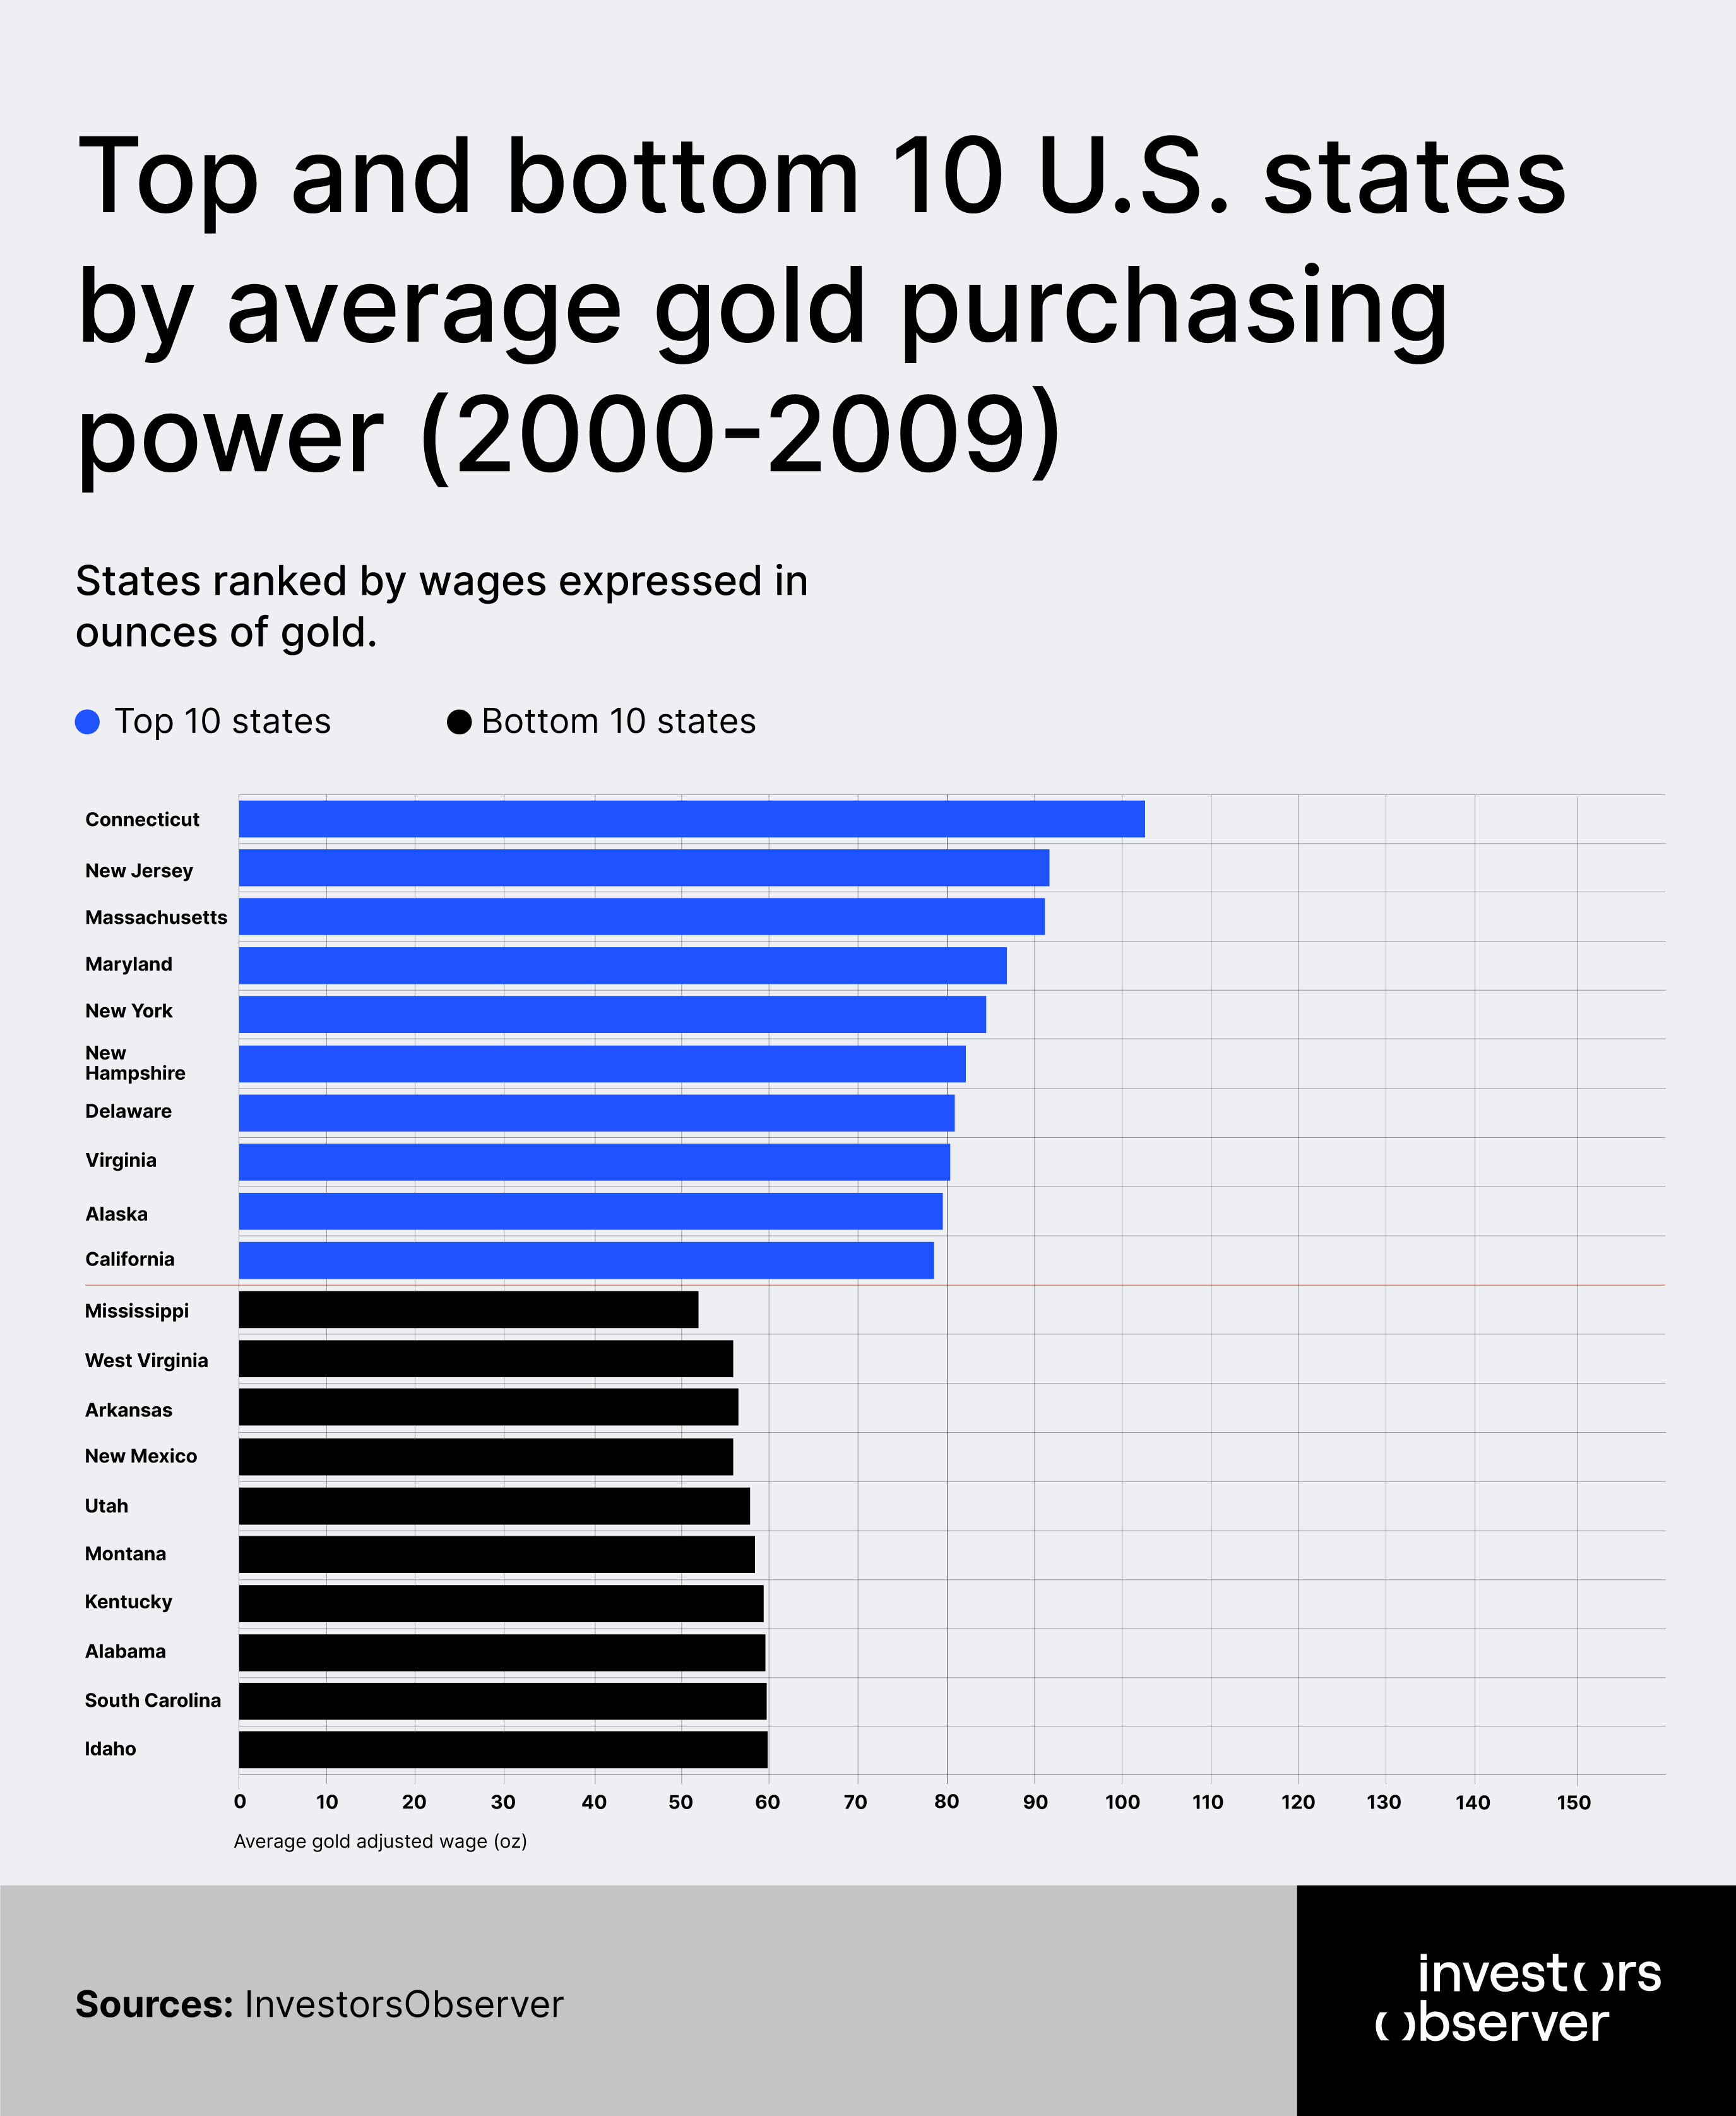
The decade's opening statistics tell the story of a nation at its economic apex, unaware that it was at the precipice of systematic wage destruction. In 2000, the national average of 107.16 represented robust worker compensation, with the median state reaching 105.6. Connecticut led at 157.4, followed by New Jersey at 144 creating a tier of truly prosperous workers whose paychecks could generate substantial wealth accumulation.
Even traditionally poor states like Mississippi (79.4) and West Virginia (81.8) offered workers purchasing power that would be considered exceptional by today's standards.
The initial surge to 2001's peak of 109.5 created false confidence that the prosperity of the late 1990s would continue indefinitely. Connecticut workers reached the highest gold-adjusted wages ever recorded at 161.4. Financial centers dominated the top rankings: New Jersey (144.1), Massachusetts (142.4), and New York (133.3) formed a powerful corridor of worker prosperity.
These numbers represented families who could realistically transform modest savings into substantial precious metals holdings, building wealth that could withstand monetary uncertainty.
Then came the collapse. The dot-com crash of 2001-2002 triggered an 18.8% national decline in a single year, wiping out more wealth than most economic downturns in entire decades.
This was financial devastation that left workers across America suddenly poorer in real terms despite often receiving nominal wage increases. The technology centers that had led the prosperity boom became ground zero for the wage collapse, with states like Colorado, Delaware, and California experiencing the steepest initial drops.
The middle years of the decade brought relentless, grinding decline that wore down worker purchasing power with mathematical precision. From 2002 to 2005, gold-adjusted wages plummeted another 24%, bringing the national average from 88.10 to just 66.84.
This steady erosion affected every corner of America, from the financial districts of Manhattan to the farming communities of Nebraska. Workers watched their paychecks lose purchasing power month after month, year after year, in a systematic transfer of wealth that left families increasingly vulnerable to economic uncertainty.
The geographic patterns of destruction reveal how comprehensive this collapse truly was. Wealthy states that had entered the decade with gold-adjusted wages above 120 saw their workers' purchasing power devastated.
From 2001 to 2009, California plummeted from 121.9 to 38.0 (-68.8%), while Colorado crashed from 124.4 to 36.7 (-70.5%). These technology and finance centers, once symbols of American economic dynamism, became casualties of monetary policies that benefited asset holders while destroying wage purchasing power.
Even more tragically, the states that had started the decade with modest wage levels experienced equally severe declines. Mississippi workers, already earning the lowest gold-adjusted wages nationally at 79.4 in 2000, watched their purchasing power collapse to just 27.5 by 2009 – a 65.3% decline that pushed working families into genuine economic desperation.
Arkansas (83.5 to 28.6, -65.7%) and West Virginia (81.8 to 28.9, -64.7%) followed similar trajectories, creating a national landscape where even full-time work couldn't provide basic financial security.
The period from 2005 to 2007 brought an accelerating decline as pre-crisis monetary policies further eroded wage purchasing power. The national average fell from 67.5 to 46.6, a crushing 31% decline that left American workers increasingly desperate.
By 2007, only 14 states maintained gold-adjusted wages above 50, compared to 26 states that had achieved this level in 2000. The systematic nature of this decline suggested structural rather than cyclical problems in the American economy.
The 2008-2009 financial crisis delivered the killing blow to American wage purchasing power. The 22.2% decline in 2008-2009 represented the steepest single-year drop between 1998 and 2024, pushing the national average down to just 35.6.
This collapse affected every region with brutal equality: financial centers fell 67.6%, technology hubs dropped 69.2%, and even energy-producing states declined 63.5%. The Rust Belt, already weakened by decades of deindustrialization, suffered a 69.1% decade-long decline that left manufacturing workers particularly vulnerable.
By 2009, the economic landscape had been fundamentally transformed. Only 10 states (less than 20% of the nation) maintained gold-adjusted wages above 40. Connecticut (54.3) and New Jersey (45) led this devastated field, but even these "successful" states had lost nearly two-thirds of their workers' purchasing power.
Nine states had completely collapsed at or below 30, with Mississippi hitting rock bottom at 27.5, followed closely by Idaho (28.4) and Arkansas (28.6).
The most telling statistic involves the states with catastrophic losses exceeding 70%. Michigan and Nevada both fell 71.9%, while Colorado and Georgia each declined 70.5%. These weren't marginal adjustments.
They represented the systematic destruction of worker wealth accumulation potential across diverse economic sectors and geographic regions. Auto manufacturing, gaming and tourism, technology, and traditional agriculture all proved equally vulnerable to the forces eroding wage purchasing power.
The regional analysis reveals no safe havens for American workers during this decade of destruction. Energy states, theoretically protected by commodity price increases, still declined 63.5%.
The traditional South, already starting from lower baselines, fell 66.9%. Most devastatingly, the financial centers that had led American prosperity declined 67.6%, showing that even workers in the nation's economic command centers couldn't escape the systematic erosion of wage purchasing power.
The collapse phases tell the story of accelerating destruction. The initial 2001-2002 crash (-18.8%) was followed by steady erosion from 2002-2005 (-24%), then accelerating pre-crisis decline from 2005-2007 (-31%), and finally the financial crisis devastation of 2007-2009 (-23.5%).
Each phase built upon the previous destruction, creating a compound effect that left American workers with less than one-third of their decade-opening purchasing power.
Perhaps most significantly, this wasn't a story of recovery following a crisis. Unlike traditional recessions where workers eventually recover lost ground, the 2000s created permanent structural damage to American wage purchasing power.
The decade's end left workers in a fundamentally weakened position relative to asset holders, with implications that would extend far beyond the immediate crisis period.
American workers had subsidized broader economic policies through the systematic devaluation of their labor's real worth, creating conditions where even full-time employment couldn't provide the financial security that previous generations had taken for granted.
The 2010s: false dawn of recovery
The 2010s began with American workers facing the toughest job market in decades, emerging from the devastating 2000s with gold-adjusted wages averaging just 28.4 – less than one-third of their 1998 levels.
What followed was a decade that would tantalize workers with the promise of recovery while ultimately delivering only partial restoration that left them profoundly weaker than previous generations. This was the decade of false hope, where statistical improvements masked continued structural weakness in American wage purchasing power.
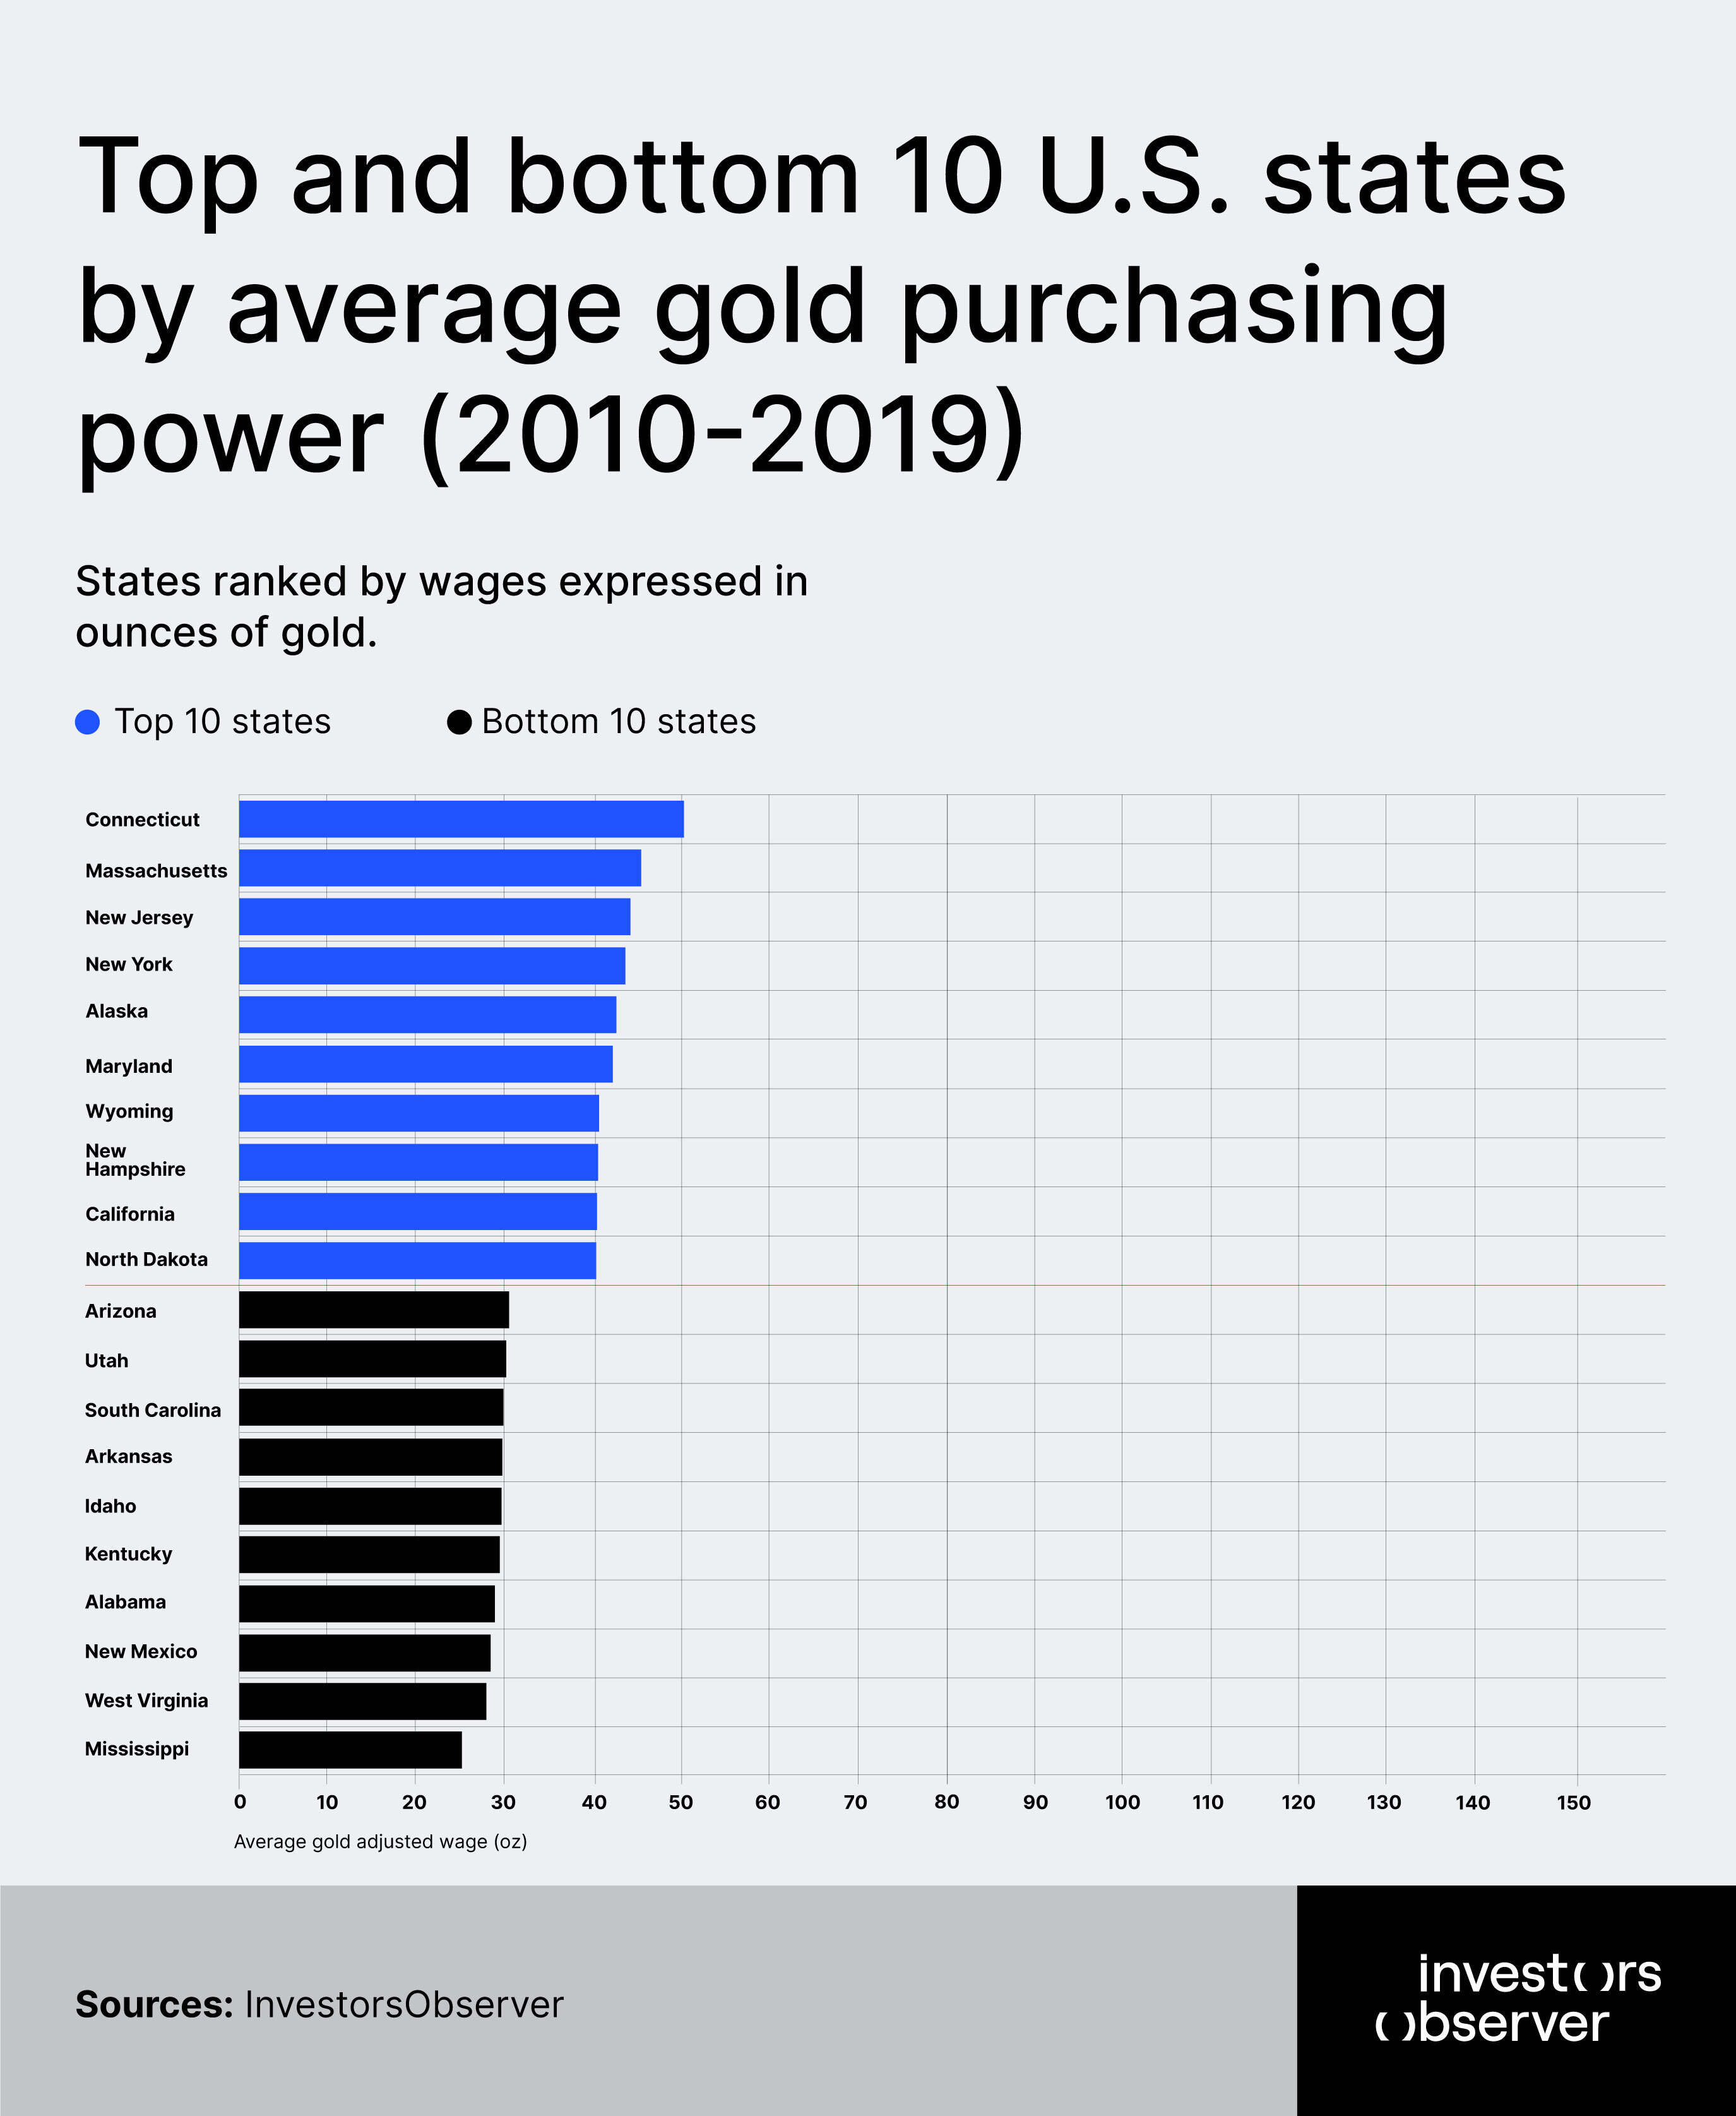
The decade began with workers still reeling from the financial crisis, their purchasing power having been systematically destroyed over the previous ten years. Even the strongest states offered only modest compensation: Connecticut managed 43.2, and Massachusetts reached 37.1 – figures that would have been considered catastrophic failures in the prosperity of the late 1990s.
The bottom tier told an even more worrying story, with Mississippi workers earning gold-adjusted wages of just 22.0, while Idaho (22.5), Utah (22.5), and Arkansas (22.7) clustered near historic lows.
The early 2010s initially offered little hope, as gold-adjusted wages continued their decline through 2012, reaching an all-time trough of 26.2 nationally. This represented the lowest point of American worker purchasing power, a moment when even the most prosperous states could barely achieve compensation levels that had been considered poverty-level just fifteen years earlier.
Connecticut, the former champion of worker prosperity, managed only 40.3 at the trough – less than half its value at the turn of the millennium.
Then came what appeared to be miraculous recovery. The 2012-2013 surge delivered a stunning 19.82% national increase, lifting workers from their lowest point and creating genuine optimism about restored prosperity.
States across America participated in this improvement: California jumped from 28.5 to 39.7, Colorado soared from 27.2 to 37.6, and even struggling Mississippi climbed from 20.0 to 26.4. For the first time since 2001, American workers could believe their purchasing power might return to historical norms.
The recovery continued through 2015, when gold-adjusted wages reached their decade peak of 39.46 nationally. This represented a remarkable 69.9% improvement from the 2012 trough, creating the impression that American workers had turned a corner toward restored prosperity.
Connecticut reached 62.4, and Massachusetts achieved 58.0. Technology centers were leading, with California (50.7), Washington (49.4), and Colorado (48.4) demonstrating the new economy's potential to restore worker purchasing power.
Yet this recovery proved to be a cruel mirage. The geographical distribution of gains revealed the fundamental limitations of the decade's progress. Technology hubs averaged 40.2% improvements, driven by specific industry dynamics that couldn't be replicated nationwide.
States with energy booms from fracking and high commodity prices saw wages rise by 22%, but this growth was short-lived. Even financial centers, traditional bastions of high compensation, achieved only modest 22.9% improvements that left workers far below historical norms.
The recovery's inherent weakness became apparent in its persistent volatility. Unlike the steady prosperity of earlier decades, the 2010s featured wild swings that demonstrated underlying instability.
The 2015-2016 decline (-6.2%) was followed by further deterioration in 2016-2017 (-8.7%), then brief recovery in 2017-2018 (+6.0%), and finally crushing decline in 2018-2019 (-12.0%). This pattern revealed that worker gains remained fragile and vulnerable to broader economic forces beyond their control.
The most damning evidence of the recovery's false nature emerged in cross-temporal comparisons. By 2019, not a single state had recovered to its 2007 pre-crisis levels, let alone its 2001 peak.
The best-performing state in 2019 – Connecticut at 49 – still fell 47.1% short of the average 1998 state's performance. Even more starkly, the median state in 2019 (34.5) remained 50.7% below Mississippi's 1998 level of 70.0, showing how completely the foundation of American worker prosperity had been destroyed.
The decade's end brought a devastating perspective on what had initially appeared to be meaningful recovery. The 2015-2019 collapse affected virtually every state, with 51 of 52 jurisdictions experiencing double-digit declines from their mid-decade peaks. Alaska fell 25.4%, North Dakota dropped 25.2%. This seemed to be a systematic erosion that revealed the recovery's fundamental unsustainability.
Technology centers, which had led the recovery, proved equally vulnerable to its reversal. California declined 16.5% from its 2015 peak, Washington fell 15.4%, and Colorado dropped 16.6%.
These states had briefly offered hope that new economic dynamics could restore worker purchasing power, but their retreat demonstrated that even the most advanced sectors couldn't escape the broader forces suppressing American wages relative to hard assets.
Energy boom states experienced even more dramatic reversals as commodity cycles turned. Wyoming plummeted 22.9% from its 2015 peak, North Dakota fell 25.2%, and Alaska declined 25.4%. These states had temporarily benefited from specific resource extraction dynamics, but their collapse revealed how dependent supposed recovery had been on unsustainable commodity price increases.
The persistence of weakness in traditional manufacturing and agricultural states provided additional evidence of the recovery's limitations. Six states – Mississippi (25.8), West Virginia (28.1), Alabama (28.3), New Mexico (28.5), Kentucky (28.6), and Arkansas (28.8) – remained below 30 throughout the entire decade's supposed recovery.
These workers, representing millions of American families, never participated meaningfully in the economic improvements that dominated national narratives.
The decade's distributional changes told a story of modest improvement that masked continued structural weakness. While the number of states with gold-adjusted wages above 40 increased from 2 to 11, and those in the 30-40 range expanded from 10 to 34, these gains occurred at such low absolute levels that they represented statistical rather than substantive improvement.
The best 2019 performance – Connecticut’s 49 – would have ranked even below the worst states in 1998.
Regional analysis revealed the uneven and ultimately insufficient nature of the recovery. Technology hubs achieved the strongest gains (+40.1%), but started from such devastated baselines that even these improvements left workers far below historical norms. Financial centers (+22.9%) and the Rust Belt (+26.7%) showed modest improvement, while energy states (+21.6%) and the traditional South (+24.8%) lagged despite resource booms and manufacturing reshoring initiatives.
The volatility that characterized the entire decade demonstrated the fragility of worker gains in an economy increasingly dominated by asset price fluctuations and monetary policy.
Unlike the steady prosperity of earlier eras, workers in the 2010s experienced wild swings that made financial planning impossible and wealth accumulation extraordinarily difficult. The 2012-2013 surge (+39.5%) was followed by steady gains through 2015, then immediate reversals that wiped out much of the progress.
Perhaps most significantly, the decade revealed the mathematical impossibility of restoring American worker prosperity within existing economic structures. Even the most successful recoveries – Utah (+40.8%), Colorado (+40.6%), and Washington (+40.4%) – occurred from such devastated starting points that they left workers dramatically worse off than previous generations.
The fundamental relationship between wages and asset prices had been permanently altered, creating conditions where even exceptional performance delivered only modest absolute improvement.
The 2010s ultimately represented not recovery but stabilization at historically unprecedented levels of worker weakness. Maybe statistical improvements provided comfort to policymakers and economists.
However, American workers remained trapped at compensation levels that would have been considered economic catastrophe just two decades earlier, with no realistic path toward restoring the purchasing power that had once made middle-class prosperity attainable for ordinary families.
The 2020s: new pressures on working Americans
At the start of the decade, in 2020, American workers continued to lose their purchasing power as the national average of gold-adjusted wage fell to 27.38. In 2021, it rose to 31.80 but this was still a far cry from the 91.49 of 1998.
This renewed decline shows how external shocks – from a global pandemic to supply-chain crises and aggressive monetary policy – continue to erode workers’ real compensation when measured against a hard‐asset standard.
Regional patterns reveal broad‐based declines. The Northeast suffered an 11.95% drop, the Midwest 11.18%, Southeast 9.57%, and West 8.38%. Working families from Vermont to Mississippi have felt the squeeze, with no region spared by the latest erosion of purchasing power.
Some states bucked the trend better than others. Wyoming lost only 3.91% of its gold‐adjusted wages, followed by Utah (–5.91%), Montana (–6.51%), Florida (–6.7%), and Colorado (–7.15%).
These states’ industries (energy in Wyoming and Montana, tech and tourism in Utah and Florida) provided partial insulation. Conversely, Pennsylvania led the declines at –15.19%, followed by North Dakota (–14.14%), Rhode Island (–13.82%), Kansas (–13.75%), and New Jersey (–12.83%). Even states that had briefly reclaimed strong purchasing power saw dramatic backslides.
Several forces drove this renewed downturn. The COVID-19 pandemic unleashed unprecedented fiscal and monetary intervention, inflating asset prices even as wage growth stalled.
Supply chain disruptions and labor market dislocations further strained household budgets. When gold prices surged, they effectively deflated wages that were already struggling to keep pace with consumer price inflation.
The decade’s volatility highlights a crucial reality: American workers remain vulnerable to macroeconomic shocks that benefit asset holders at the expense of labor. The 2010s recovery peak of 39.46 ounces in 2015 now seems a distant memory – most states’ real wages are back near the low-30s.
Families face mounting challenges as wages repeatedly fail to match asset price inflation, undermining wealth accumulation and financial security.
The 2020s threaten to extend this pattern of wage suppression. Unless policies address the structural disconnect between labor compensation and asset price inflation, working Americans will continue to lose ground – no matter how robust headline economic growth or stock market performance might appear.
Gold-adjusted wage trends in 2025
The final numbers for this year aren’t in yet, but 2025 is already shaping up to be a challenging year for working Americans, at least when measured against gold.
If an average person tried to trade their yearly income for gold, they would get less of it than almost any time in recent history. Clearly, the real purchasing power is getting worse.
The gold price soared to an average of $3,827 per ounce by late September 2025, while wage growth didn’t keep up. According to the Bank of America, in September, wages for higher-income households grew by 4.0% over the past year, while those for lower-income households increased more modestly, by 1.4% year-over-year.
In contrast, in 2024 the average gold price was about $2,624 per ounce. This difference led to a dramatic fall in the number of gold ounces that annual incomes could purchase.
While many Americans see nominal income rising, in gold terms, the ability to buy hard assets like gold has deteriorated to its lowest level in at least 26 years.
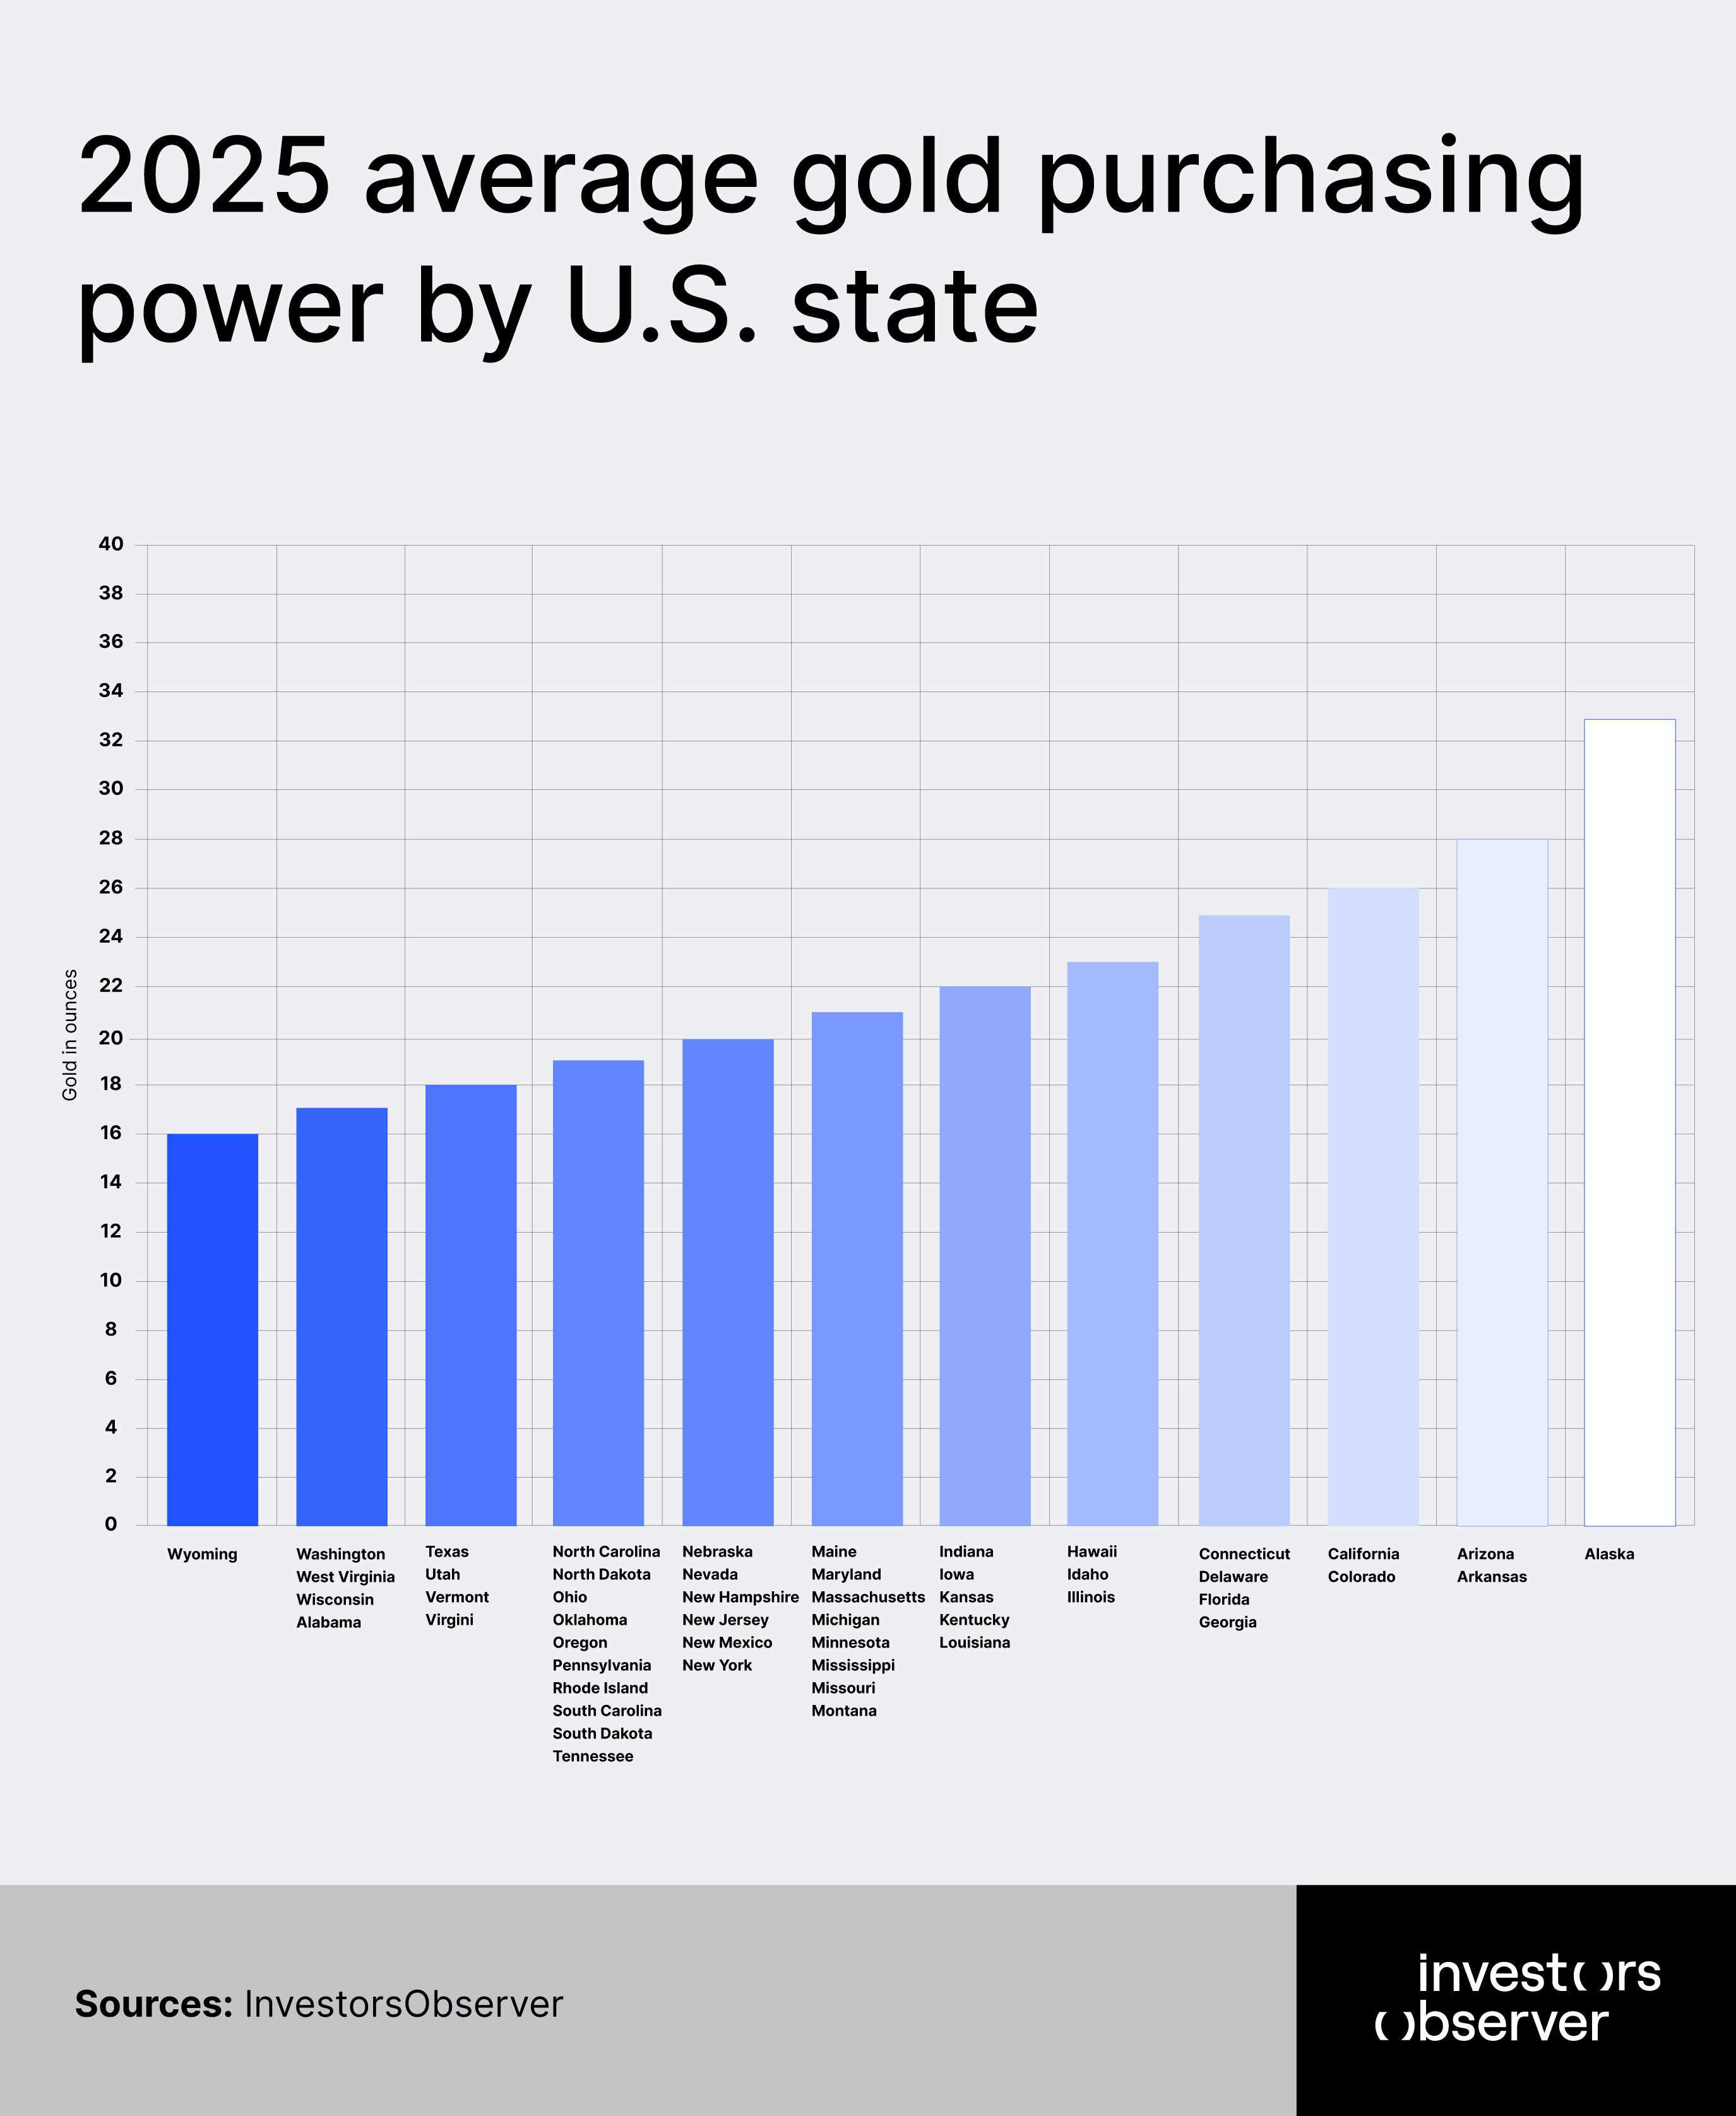
In almost every state, the number of gold ounces afforded by per capita income declined from 2024 to 2025. For example:
- Alabama – 2024 income could buy about 22 ounces of gold, but by 2025 this dropped to just 17 ounces.
- In California the figure fell from about 33 to 26 ounces.
- Wyoming now has the lowest purchasing power as the figure fell from 33 to 16.
This pattern held across the country, with the biggest declines often seen in states where living costs were already high but wage growth lagged behind the surge in gold prices.
These figures show that 2025 has seen significant contraction in the true value of wages for American workers, and any sense of rising prosperity when measured only in dollars, can be illusory.
Geographic patterns in wage destruction
While every state experienced significant real wage declines, some regions showed more resilience than others. Western states like Wyoming, Montana, and Utah experienced the smallest drops, largely due to energy and mining sectors that provided some natural hedge against precious metals price increases.
These economies, still tied to commodity production, offered partial protection against broader monetary forces.
On the other hand, traditional economic centers suffered disproportionately. Delaware, Michigan, and Nevada saw the steepest declines, with drops exceeding 73%. These states, once symbols of American economic strength and industrial might, found their workers particularly vulnerable to the systematic erosion of wage purchasing power against hard assets.
The consistency of decline across regions – with every area seeing 68-71% drops – suggests this represents a fundamental shift in American economic structure rather than isolated regional problems.
From Silicon Valley to the Rust Belt, from oil fields to financial centers, American workers have experienced systematic weakening of their compensation's real value.
What this means for American workers
This analysis reveals the truth often obscured by complex economic statistics: American workers today operate with dramatically less real wealth-building capacity than their counterparts just 25 years ago.
A paycheck that could once provide substantial financial security now offers a fraction of that protection against monetary uncertainty.
The implications go beyond precious metals ownership. Gold-adjusted wages serve as a proxy for broader purchasing power erosion affecting everything from housing to education to retirement planning.
Workers today face challenges in wealth accumulation that previous generations never encountered, helping explain delayed homeownership, extended financial dependence, and retirement insecurity.
This research also suggests that traditional metrics of worker prosperity may not capture the full picture of American labor's financial reality.
While unemployment rates fall and nominal wages rise, this analysis reveals a profound weakening in the foundation of worker financial security that affects every corner of the nation.
The systematic nature of this decline raises important questions about monetary policy, wage policy, and the relationship between asset price inflation and worker compensation.
This research shows that American workers have been losing the real value of their wages compared to stable assets or stores of value (like gold). In effect, through economic changes and policies, the purchasing power of their labor has declined, which subsidizes or supports the broader economy by keeping costs or wages lower than they might otherwise be.
Essentially, workers are bearing a hidden cost by accepting wages that buy less over time relative to these valuable benchmarks.
Methodology
This analysis examined gold-adjusted wages across all 50 U.S. states. The data represents wages deflated by gold prices, providing a measure of real purchasing power using gold as an inflation benchmark rather than traditional consumer price indices.
Gold-adjusted wages were calculated by deflating nominal wage data by corresponding gold prices, creating an index that measures how wage growth compares to gold price increases over time.
For consistency, the price recorded for each year corresponds to the closing value on the last calendar day of that year (December 31).
To calculate the gold-adjusted income, we divided each state’s per capita personal income by the corresponding gold price for that year. This expresses annual income in terms of ounces of gold rather than dollars. For example, in Alabama in 1998, the average per capita income equaled approximately 79 ounces of gold, while in 2024 it equaled only 22 ounces.
Values above baseline indicate wages outpacing gold price inflation, while declining values show wages falling behind precious metals price appreciation.
The dataset spans 28 years across 50 states, providing comprehensive coverage of American wage performance against hard asset benchmarks. Regional analysis follows standard geographic classifications to identify geographic patterns in wage purchasing power erosion.
We also calculated the percentage change in income expressed in gold ounces over the period from 1998 to 2025 (October) in each state by tracking the change of the gold-adjusted wages.
This methodology offers an alternative perspective on real wage trends by using gold – traditionally viewed as a store of value and inflation hedge – rather than consumer goods baskets typically used in inflation calculations.
The approach provides insight into how labor compensation has performed against assets often used to preserve wealth during periods of monetary expansion.
Sources
- U.S. Bureau of Economic Analysis
- Bloomberg Terminal
- Bank of America
Your email address will not be published. Required fields are markedmarked