The one chart that shows how the American Dream fell apart in just five years
Americans’ sense of housing affordability has shifted dramatically since the pandemic, and one analyst says it all comes down to the rapid deterioration of housing attainability in recent years.
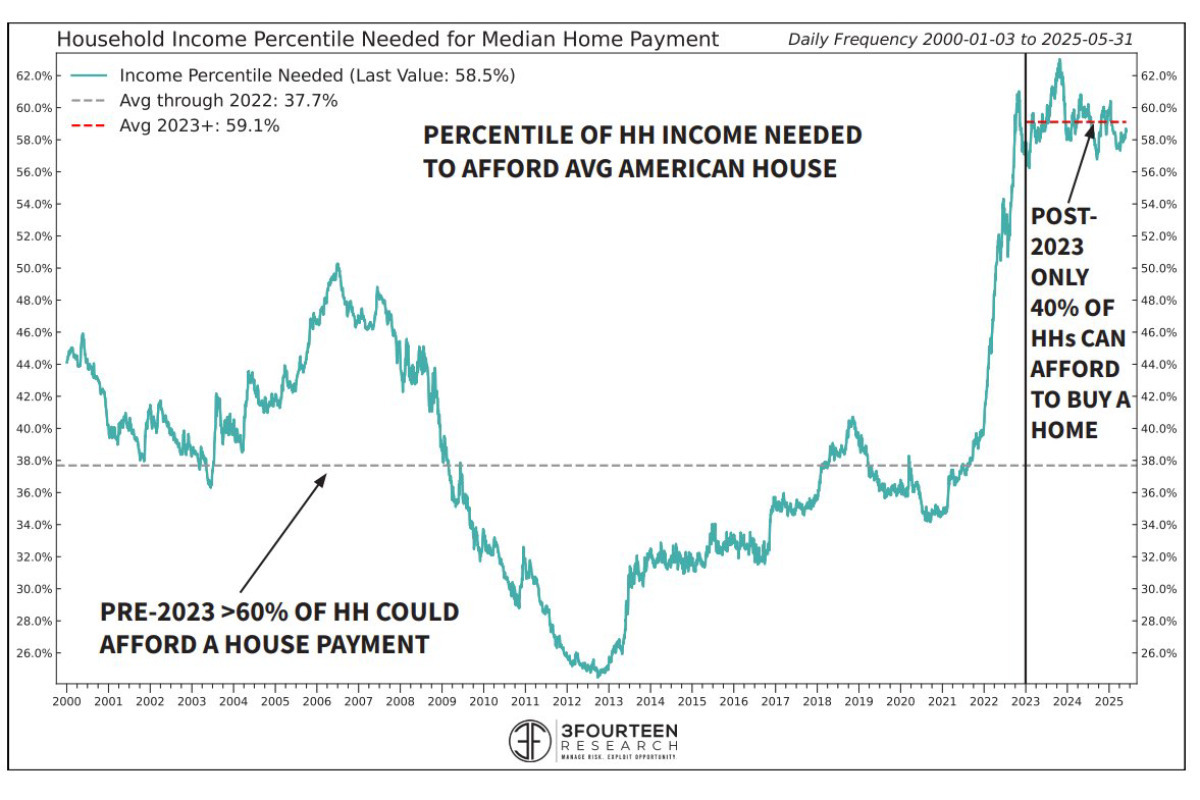
Before Covid, roughly 60% of U.S. households could afford the average home, meaning they could make the payments required to service a mortgage at prevailing rates, according to Warren Pies, founder of the investment research firm 3Fourteen Research.
Since then, that figure has plunged to around 40%, Pies noted, citing his firm’s analysis of income and housing data.
“I still believe this is the single best chart to explain the post-pandemic angst,” Pies wrote, referencing data showing the percentile of household income needed to afford the average American house.
I still believe this is the single best chart to explain the post-pandemic angst.
undefined Warren Pies (@WarrenPies) November 8, 2025
It is also why the Trump Admin is now considering 50-year mortgages.
% of U.S. households that can afford the median home:
-Pre-covid- 60%
-Post-covid- 40% https://t.co/Lv4cQWG4Qm
His chart shows that affordability briefly improved between 2019 and the early months of the pandemic, before reversing sharply as home prices and interest rates surged.
Pies added that there’s now significant political pressure on the Trump administration to address the housing crisis, which could explain why Trump is considering a 50-year mortgage as a potential solution.
The proposal, confirmed over the weekend by Federal Housing Finance Agency (FHFA) Director Bill Pulte, would extend the maximum amortization period for homebuyers from the current 30 years.
As of last week, the average interest rate on a 30-year fixed mortgage stood at 6.22%, according to Freddie Mac.
Restoring housing affordability has no easy fix
Extending mortgage terms, and thereby lowering monthly payments, is no silver bullet for the housing affordability crisis.
As CBRE Investment Management notes, the issue extends far beyond mortgage rates. The biggest challenge remains the lack of supply, particularly of smaller, entry-level homes.
“The shortage of smaller homes to meet increasing demand from new, smaller and older households is particularly acute. The current demand is a mismatch with the vast majority of existing stock,” CBRE said.
The persistent lack of supply helps explain why home prices continue to climb even as sales decline. In the third quarter, home prices rose in 77% of U.S. metro areas, according to the National Association of Realtors.
Research from the Harvard Joint Center for Housing Studies also highlights another pressure point: rising costs for home insurance and property taxes, which are further eroding affordability.
As a result, the number of “cost-burdened” homeowners, those spending more than 30% of their income on housing-related expenses, has climbed to about 20.3 million, or nearly one in four homeowner households.
The Harvard study also found that home insurance premiums increased by 57% between 2019 and 2024, adding yet another layer of strain to homeowners already struggling to make ends meet.