News
'A key recession signal is flashing red' as America sleepwalks into recession, experts say
U.S. construction spending — long considered a bellwether for economic activity — has dropped for six straight months
Read more about 'A key recession signal is flashing red' as America sleepwalks into recession, experts say
“Cash is trash” — Cash allocations among BoA private clients sink to pre-crisis levels
Bank of America’s richest clients have cut cash to the lowest share since before 2008, piling into markets even as gold outshines every other asset class.
Read more about “Cash is trash” — Cash allocations among BoA private clients sink to pre-crisis levels
Mag 7 are masking recession in corporate America and economy
The “Magnificent 7” have become a poster child of a growing divide between Big Tech and the rest of corporate America.
Read more about Mag 7 are masking recession in corporate America and economy

“Sahm Rule was right all along” as BLS revisions expose massive job losses
Massive jobs revisions reveal that America’s labor market was weaker than reported, suggesting the recession signal never failed only the data did
Read more about “Sahm Rule was right all along” as BLS revisions expose massive job losses
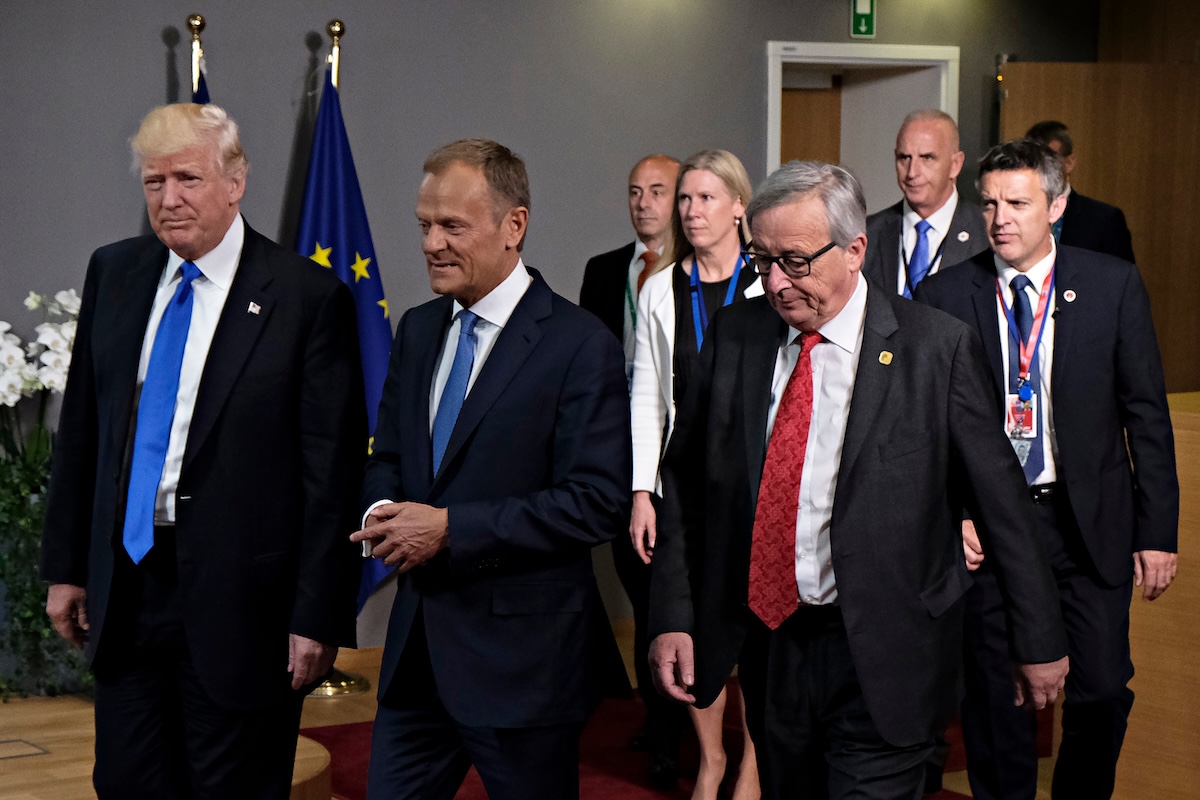
Trump lashes out at EU, but scrutiny over Google’s ad biz is growing beyond regulators
After the European Commission fined Alphabet’s Google (GOOG) €2.95 billion (USD $3.5 billion) on Friday for breaching EU antitrust rules, the ruling immediately drew the ire of President Trump.
Read more about Trump lashes out at EU, but scrutiny over Google’s ad biz is growing beyond regulators
U.S. bankruptcies skyrocket to highest level since 2008 meltdown
More than 440 large companies have filed for Chapter 11 this year, the most since the financial crisis, as Trump allies say he was right to push for faster rate cuts.
Read more about U.S. bankruptcies skyrocket to highest level since 2008 meltdown

Trump vindicated? Weak jobs data fuels Fed firestorm
Standard Chartered flags rising odds of a 50bps cut as job losses mount, while critics say the central bank risks falling behind the curve.
Read more about Trump vindicated? Weak jobs data fuels Fed firestorm
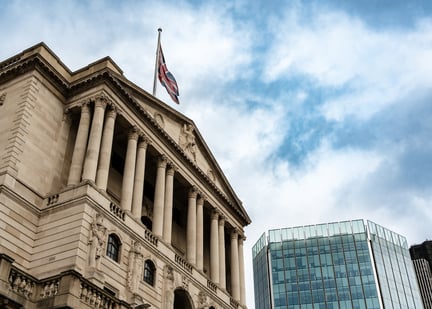
Britain’s bond market faces a reckoning as 30-year yields hit a 27-year high
Yields on 30-year gilts have surged to their highest since 1998, exposing investor anxiety over ballooning debt, weak growth, and stubborn inflation.
Read more about Britain’s bond market faces a reckoning as 30-year yields hit a 27-year high
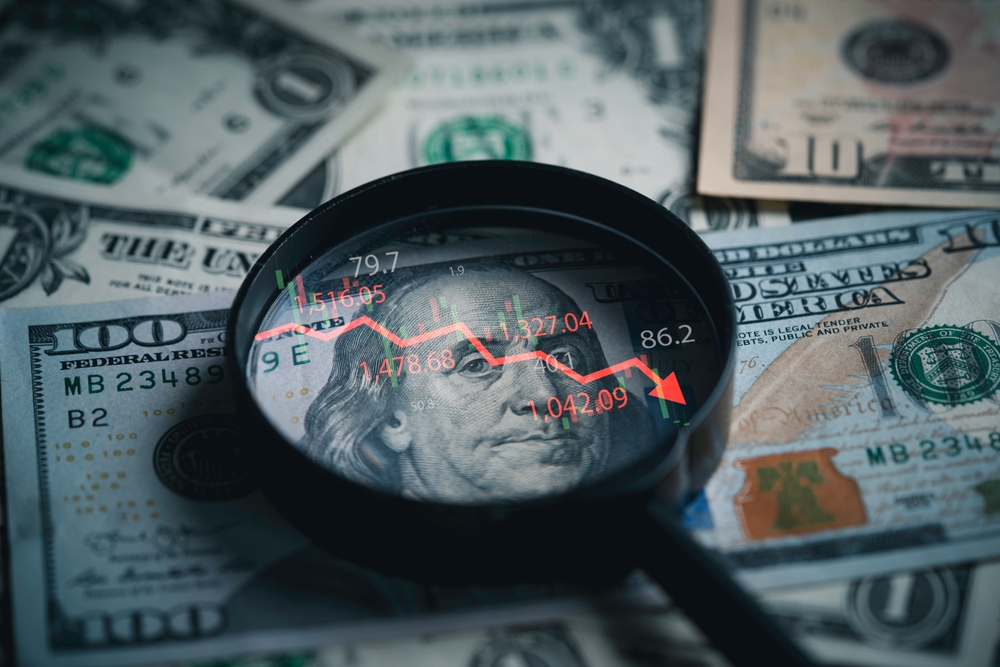
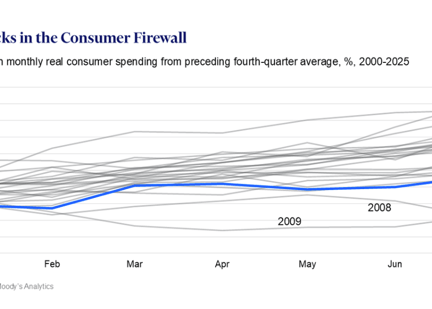
'This chart sums up the state of the U.S. economy' — economist points to biggest recession signal since 2008
Consumer spending still looks resilient on the surface, but rising debt, falling financial well-being, and signs of fatigue suggest the U.S. economy may be on the brink
Read more about 'This chart sums up the state of the U.S. economy' — economist points to biggest recession signal since 2008
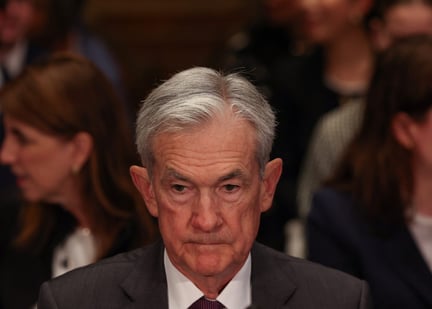
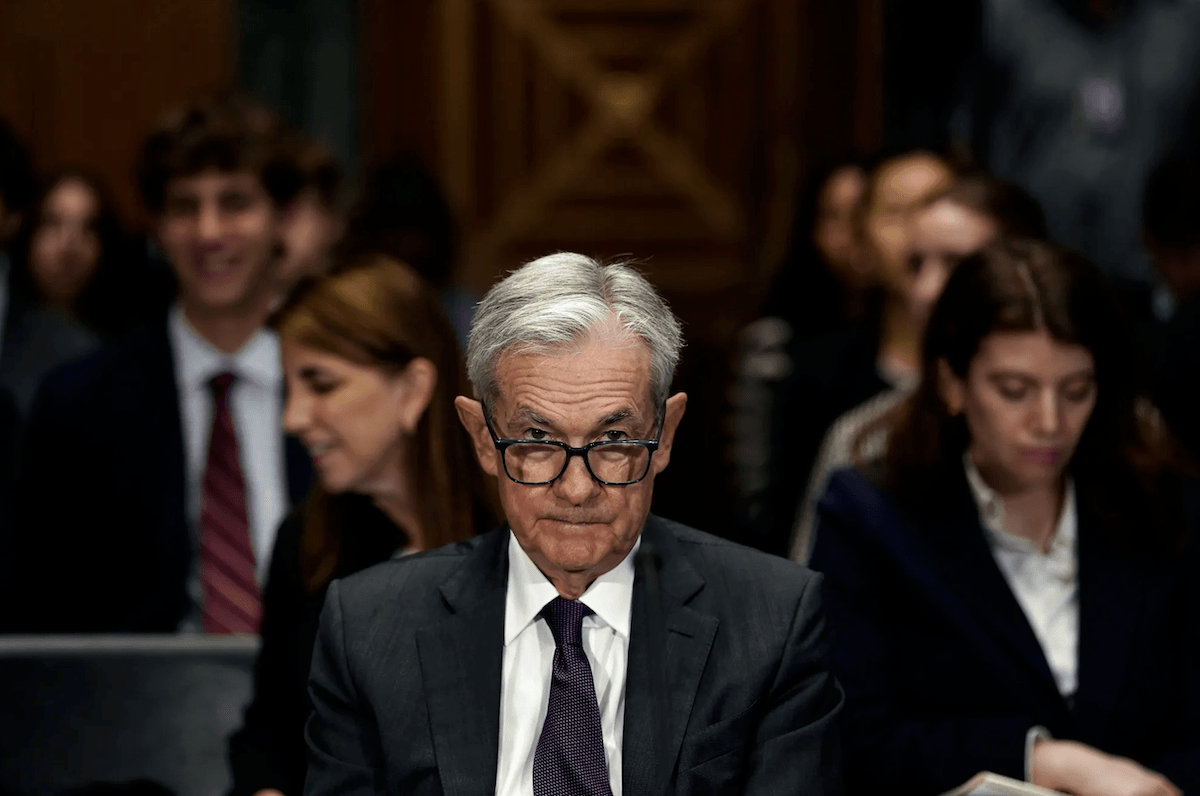
Strategist argues the Fed may have “lost all credibility when it comes to fighting inflation”
As Powell signals rate cuts despite sticky inflation, critics warn the central bank risks fueling a stagflationary spiral.
Read more about Strategist argues the Fed may have “lost all credibility when it comes to fighting inflation”
Your supposed portfolio hedge has become ground zero for America’s political crisis
Scott Opsal of the Leuthold Group called the Treasury situation “frankly terrible”
Read more about Your supposed portfolio hedge has become ground zero for America’s political crisis
'Who’s lying?' Heavy Truck Index warns of U.S. downturn as stocks trade near record highs
A little-known gauge of heavy truck sales is signaling recession risks as the S&P 500 hit records, widening the disconnect between markets and the real economy.
Read more about 'Who’s lying?' Heavy Truck Index warns of U.S. downturn as stocks trade near record highs

“Powell’s error is immense”— Ex-hedge fund manager warns Fed ignores biggest inflation risk of all
“Inflation will resurface in many forms over the next year,” he said. And if the Fed cuts too soon, it may not be ready for what comes next.
Read more about “Powell’s error is immense”— Ex-hedge fund manager warns Fed ignores biggest inflation risk of all
“This is one of the most dangerous signals in the market now” — Analysts warn that leverage is approaching a breaking point
Margin debt surges past $1 trillion, stoking fears of an overheated market just as rate-cut bets fade and stocks pull back.
Read more about “This is one of the most dangerous signals in the market now” — Analysts warn that leverage is approaching a breaking point

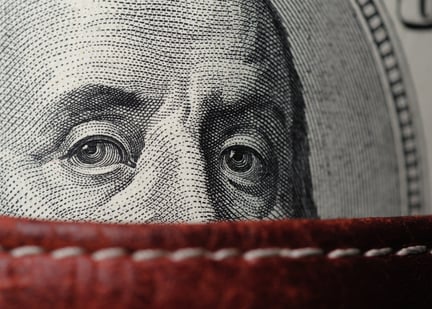
Treasury Secretary Bessent is “gaslighting” the American people on tariff revenue as government debt runs wild, analyst says
Analysts warn Trump’s plan to use tariffs to pay down the debt is a mirage, with July’s haul covering just a fraction of the monthly deficit.
Read more about Treasury Secretary Bessent is “gaslighting” the American people on tariff revenue as government debt runs wild, analyst says

Fidelity: Inexperienced retail investors are more bullish than seasoned traders
Fidelity Investments finds newer retail investors more bullish on stock markets than seasoned traders, with many embracing risk and crypto despite market volatility.
Read more about Fidelity: Inexperienced retail investors are more bullish than seasoned traders
The Fed’s high-stakes dilemma: Cut rates or confront Trump?
Traders are all but certain of a September rate cut, yet analysts warn that excess pandemic inflation and rising wholesale prices make easing a risky gamble
Read more about The Fed’s high-stakes dilemma: Cut rates or confront Trump?
Trump’s tariffs set to surpass corporate tax revenue, but won’t rescue the economy
A 300% jump in tariff revenue is no match for Washington’s $37 trillion debt and record monthly deficits
Read more about Trump’s tariffs set to surpass corporate tax revenue, but won’t rescue the economy