About today's attack


Morning Observers,
The most important fact about this morning’s attack was not that the U.S. fired missiles at a supertanker, but where that tanker was headed.
An empty, U.S.-sanctioned vessel was sailing through international waters toward Kharg Island when American forces took it out after repeated warnings.
Two important details here. First, the operation took place deep inside the Persian Gulf, far beyond the original blockade line. Second, Kharg Island is not some random destination.
Kharg Island handles roughly 90% of Iran’s crude oil exports. By stopping a tanker before it could even reach the terminal and load, Washington sent a message that it is prepared to enforce the blockade at the source.
Washington does not necessarily need to destroy Kharg Island or sink loaded tankers to halt Iranian exports. What it wants is to convince enough shipowners, insurers, and crews that approaching the terminal is no longer worth the risk.
This is effectively what Iran has already accomplished in the Strait.
Non-Iranian shipping has slowed to a trickle, with some vessels making “dark transits” without broadcasting their locations. Other tankers have abandoned attempted crossings altogether.
The International Energy Agency is now warning that the disruption must be resolved within weeks to prevent serious damage to the global economy.
Nearly three-quarters of the 400 million barrels released from IEA member countries’ reserves during the earlier phase of the crisis have already entered the market.
Meanwhile, the U.S. Strategic Petroleum Reserve has been drawn down by roughly 25% over the past four months alone and is currently at its lowest level since 1983.
So, while the market is banking on diplomacy, the world’s oil cushion is getting thinner.
- Dan Runkevicius, Editor
|
|


🏦 The world's largest asset manager keeps growing
BlackRock’s assets under management reached a record $15.3 trillion in the second quarter, adding more than $1 trillion this year alone. The firm attracted $53 billion into actively managed funds and another $178 billion into ETFs, helping drive 31% revenue growth from a year ago. The results show BlackRock is no longer relying solely on passive investing, but is also gaining traction in higher-fee active products, giving the world’s largest asset manager another powerful source of growth.
🍎 Apple clears a key hurdle in China
Apple received long-awaited approval to launch Apple Intelligence in China after partnering with Alibaba to meet the country’s AI regulations. The decision could help Apple narrow the feature gap with domestic rivals in one of its most important markets. Shares rose 4%, though the company still faces stiff competition from Chinese smartphone makers.
💳 PayPal’s $50 billion offer
Payment processor Stripe and private equity firm Advent International have reportedly offered more than $50 billion to acquire PayPal, valuing the company at roughly $60 per share. The bid comes after years of slowing growth and mounting competition, which weighed on PayPal’s stock. If completed, the deal would rank among the largest leveraged buyouts ever and suggests private investors see more value in PayPal than public markets currently do.
📉 Inflation eased off at the wholesale level
U.S. producer prices unexpectedly fell 0.3% in June after jumping 0.6% in May, pulling annual producer inflation down to 5.5%, below economists’ expectations. Because producer prices often feed into consumer inflation over time, the report added to hopes that the worst of inflation is behind.
🛍️ Inflation-adjusted consumer spending is running at two-year highs
The Chicago Fed estimates retail sales excluding autos rose 0.7% in June, marking a fifth straight monthly increase of at least that pace. After adjusting for inflation, spending is estimated to have increased 1.4%, the strongest monthly gain in at least two years. The data adds to evidence that U.S. consumers continue to power the economy.
Has China lost its commodity crown?
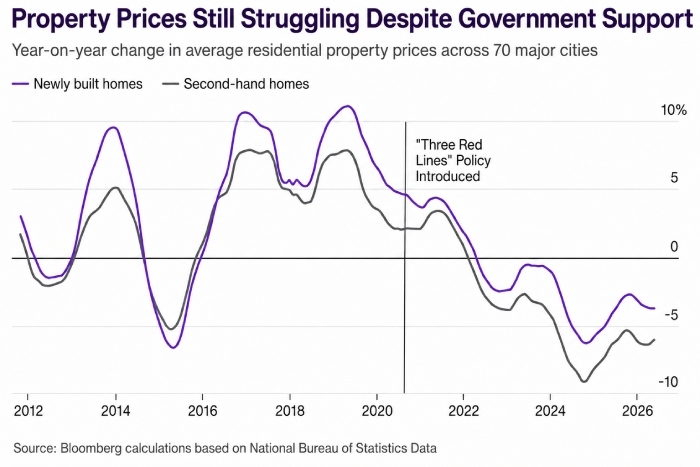
For two decades, the easiest way to forecast commodity prices was to watch China’s property market. Bank of America thinks that era is ending.
The bank’s latest forecasts suggest that the next commodity boom will replace Chinese apartment blocks with AI servers, electric grids, and investors looking for protection.
Power is replacing property
Copper remains Bank of America’s highest-conviction industrial metal, with prices forecast to reach $15,250 per metric ton by 2027, an increase of about 18% from current levels.
If governments respond to the Strait of Hormuz crisis by investing in energy independence rather than simply stockpiling oil, copper could be one of the biggest long-term beneficiaries.
BofA expects spending on power grids, domestic electricity generation, and transmission infrastructure to more than offset weaker Chinese demand.
Gold is still the insurance policy
The bank is equally bullish on precious metals, arguing that gold is defying one of Wall Street’s oldest macro rules: when real rates zig, gold zags.
BofA expects gold prices to rise roughly 18% to $4,813 an ounce by 2027, even if real interest rates remain historically high.
In today’s market, the bank’s analysts argue, central-bank buying and policy uncertainty are becoming increasingly important drivers of gold prices relative to interest rates.
📌 Bottom line: The next commodity trade depends less on Chinese housing starts and more on how much countries spend protecting themselves from geopolitical shocks.
This inflation signal has an 80% hit rate for stocks
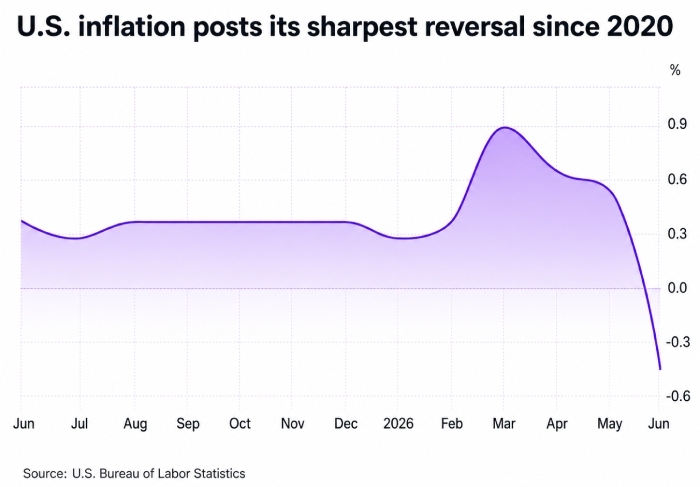
The best news for investors this week may not be that inflation is falling, but how it is falling.
In June, CPI posted its biggest monthly drop in more than five years, just one month after inflation reached a five-year high. That exact combination has occurred only 21 times since the 1940s...
...and it has usually been followed by a strong year for stocks.
A rare signal with a strong record
After the previous 21 inflation signals, the S&P 500 gained an average of 9.9% over the following 12 months, according to S&P Dow Jones data. Stocks finished higher 80% of the time.
The signal rewarded patience. One and two weeks later, stock performance was little better than a coin toss. But after three months, the S&P 500 was higher in 85% of historical cases, a success rate that held through six months.
One explanation is that investors begin pricing in fewer rate hikes and a friendlier backdrop for corporate earnings once inflation shows convincing signs of breaking.
Signs the pattern may be repeating
UBS believes inflation likely peaked in May after several components of the latest CPI report came in below expectations, including transportation, communications, and hotel prices.
Although those categories are notoriously unpredictable, UBS said underlying inflation still came in below expectations even after adjusting for their impact.
That strengthens the case that the worst of inflation is behind us and that the Fed not only will not raise rates, but could also become more comfortable cutting them.
📌 Bottom line: History suggests markets respond to turning points, not perfect inflation data. Such a sharp CPI reversal has historically favored stocks over the following 12 months.