State-by-state analysis: Americans now work up to 25 extra days a year to maintain 2007 basic living standards

Almost 20 years after the 2008 crisis, hourly wages are up 66% nationwide since 2007, and have roughly doubled in states like Idaho and Arkansas.
Yet many analysts see pre-crisis warning signs again, with one in three Americans now openly hoping for a housing crash to ease the pain.
Our new analysis helps explain why: people nationwide now have to work up to 25 extra days a year just to cover rent, groceries, and save for a used car – time stolen from vacations, kids’ soccer games, and weekends off.
InvestorsObserver analyzed hourly earnings versus these three essentials across all 50 states from 2007 to 2025. Most states haven’t escaped the squeeze, and more Americans are no longer trading time for progress – they are trading time for the bare minimum of existence. This explains the growing desperation for relief.
Key findings
- Today, just to cover rent, groceries, and save for a used car, an average American works 66 days a year.
- Just to afford rent, groceries, and save for a used car, people in Hawaii now work nearly 87 days a year – most time required out of all the states.
- Compared to 2007, the average American now works 7 extra workdays yearly to cover rent, groceries, and save for a used car.
- In the top 10 worst-hit states, workers now spend 2.5 extra years of their 40-year career earning the same rent, groceries, and car their parents could afford in 2007.
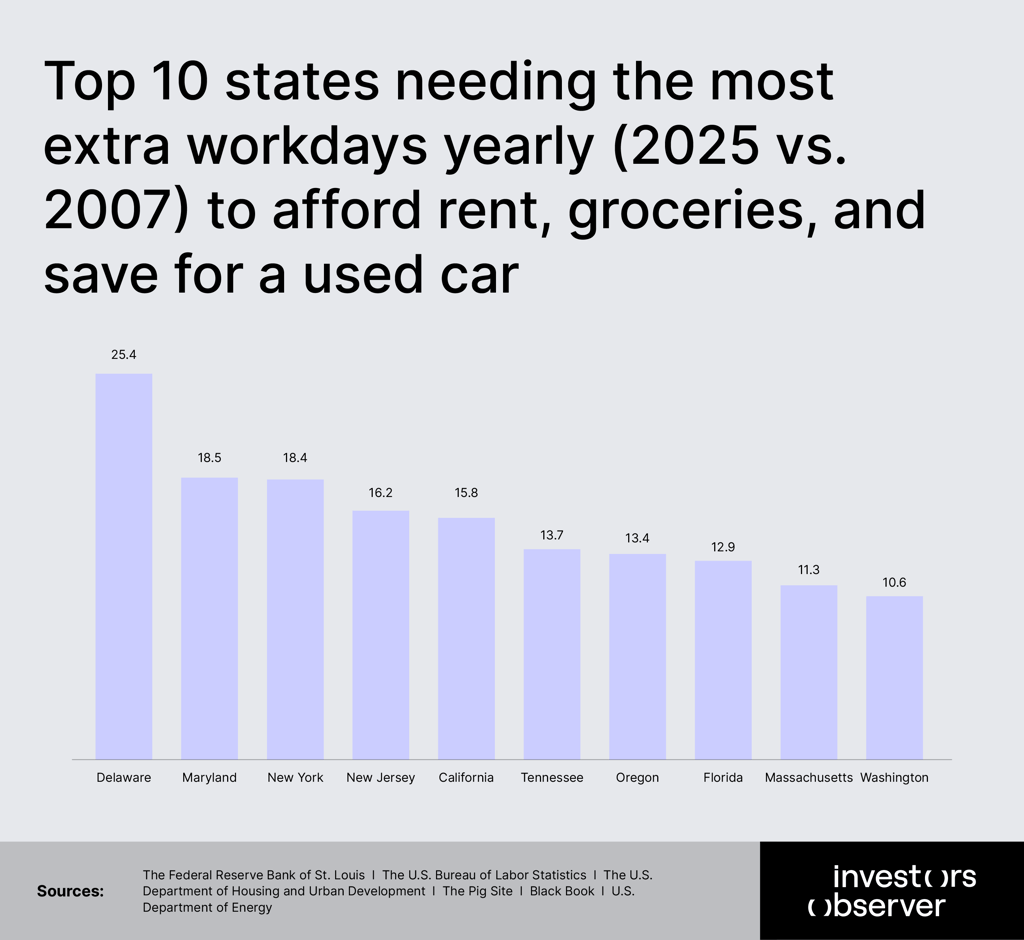
- Delaware workers need the most extra workdays a year (25.4) just to cover rent, groceries, and save for a used car.
- Idaho is the most improved state, where people now need 4.9 fewer days to cover the three basics.
Delaware workers now grind 25 extra days for basics
In the 10 hardest-hit states, Americans are putting in 15.6 extra days on average every single year just to pay the same rent, buy the same groceries and save for a used car they could afford in 2007. This means that over a 40-year career, they lose around 2.5 years of labor to inflation.
In 2007, the average American earned $20.75 per hour. By 2025, that figure had risen to an average of roughly $34.35 per hour – a 65.6% increase that, on paper, sounds significant.
The problem is that the cost of basic necessities didn’t just rise 65.6%. They ran far ahead of it.
Delaware tops the list, requiring workers to put in 25.4 additional 8-hour workdays annually. That translates to more than five full work weeks, or nearly 10% of an entire work year, just to maintain the same standard of living they or their parents enjoyed in 2007.
Used cars got even more expensive. In 2007, anywhere in the county the typical passenger car on the road was 9.2 years old, and a Delaware employee spent 35 hours a year working to save for it. By 2025, those hours ballooned to over 61, even as the average car age climbed to 12.8 years.
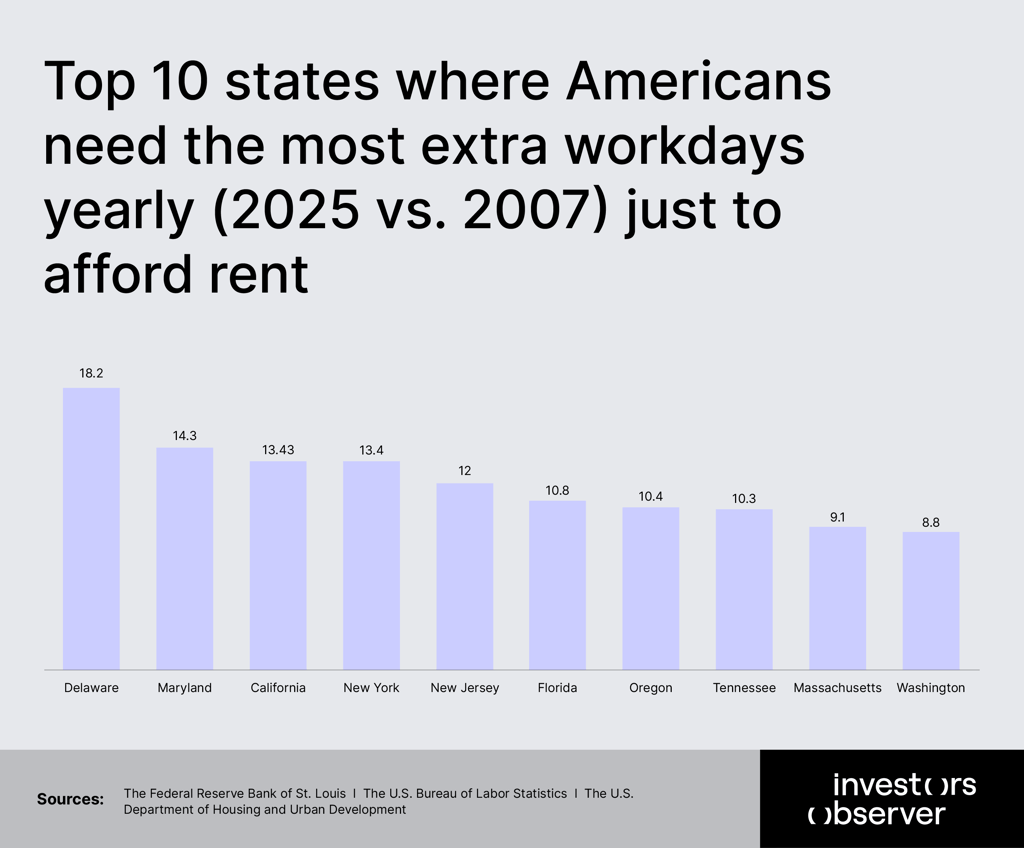
Despite earning $32.54 per hour in 2025 compared to $25.37 in 2007, Delaware workers face a housing market that has spiraled beyond wage growth, with rent alone accounting for 18.2 of those extra days.
The Mid-Atlantic corridor dominates the ranking. Maryland claims second place with 18.5 extra days, followed closely by New York at 18.4 days and New Jersey at 16.2 days.
These densely populated states share a common thread: explosive housing costs in major metropolitan areas where rent increases have significantly outpaced even robust wage gains. A Maryland worker earning $35.86 per hour in 2025, up from $24.00 in 2007, still can't keep pace with the cost of living.
California rounds out the top five at 15.8 extra days, despite boasting one of the highest average hourly wages in the country at $40.93. The Golden State’s notoriously expensive housing market continues extracting an ever-growing time tax from its workforce.
Perhaps most surprising are states like Tennessee (13.7 days) and Florida (12.9 days), traditionally considered affordable alternatives to coastal metros. Tennessee wages grew 61.3% from 2007 to 2025, yet workers still find themselves running harder just to stay in place.
Florida's explosive population growth and housing demand have transformed it from a retirement haven into an affordability crisis zone.
The Pacific Northwest isn’t spared either. Oregon (13.4 days) and Washington (10.6 days) complete the top ten, with Massachusetts wedged between at 11.3 extra days. Even Massachusetts workers earning $42.50 per hour, the second-highest in this group, must work an extra 2.3 weeks annually.
The top 10 states show a clear pattern: coastal states with high population density and desirable metro areas are extracting the highest time penalty from their workers, regardless of wage levels.
Longest grind: Hawaii workers now work almost 87 days a year just for a few basics
In some states, the gap between 2007 and 2025 is smaller, but even there, the total workdays required now exceed many others.
In Hawaii, workers must labor for 86.6 full 8-hour days a year to afford the three essentials: annual rent for a one-bedroom apartment, a year’s worth of groceries and the ability to save for a used car.
It’s roughly one-third of the year, dedicated solely to baseline necessities before a dollar can be spent on health care, debt payments or discretionary purchases.
The East Coast dominates the list of states where workers spend the most time earning these basics. New Jersey ranks second, requiring 83.6 workdays, followed closely by Maryland at 80.9 days and Delaware at 80.3 days.
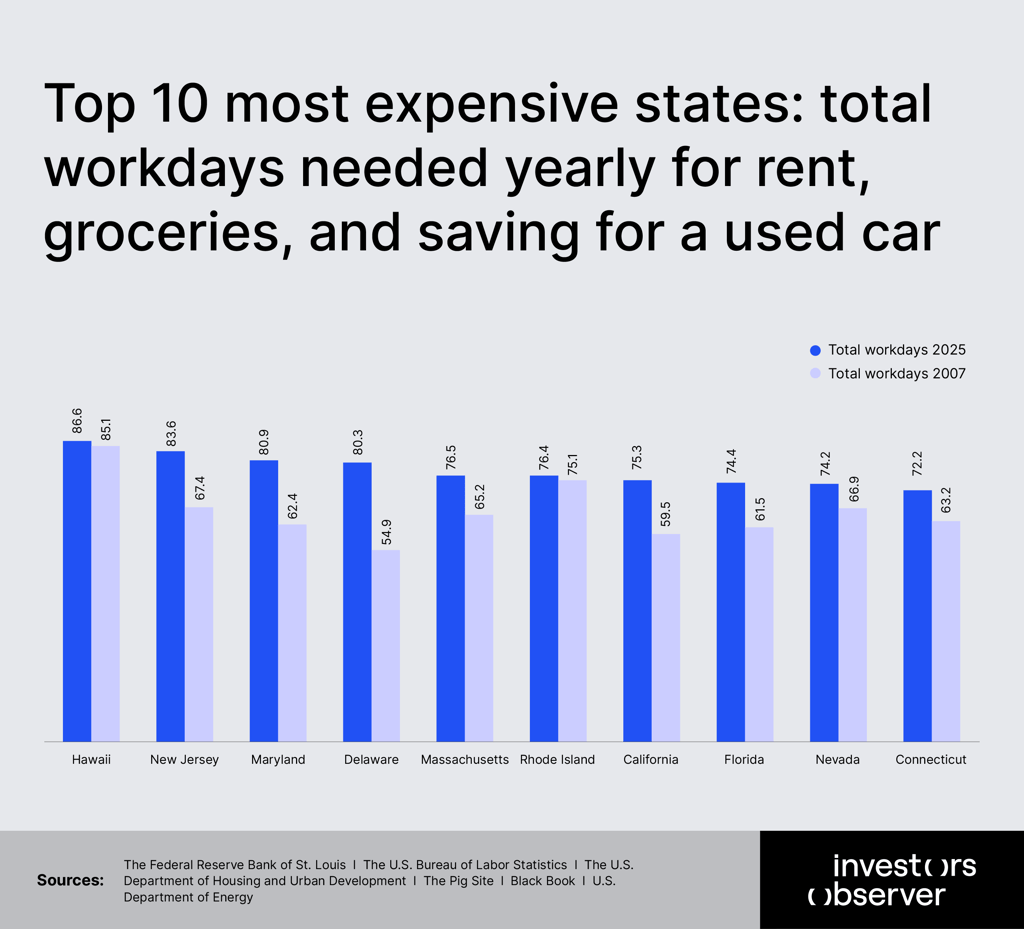
Massachusetts and Rhode Island, despite relatively high wages and strong economies, still demand more than 76 workdays each. A worker in Boston earning well above the national average still allocates more than three months of income to these three categories alone.
California, at 75.3 days, not only has the biggest change between 2007–2025 but also is among the states where people have to spend the most hours just to cover the basics. It reflects the persistent affordability challenges that have driven policy debates and migration patterns for years. The state’s high wages have not kept pace with housing costs that continue to rise in major metropolitan areas.
Florida ranks 8th with 74 extra workdays, a big change for the retiree magnet that’s always been quite cheap to live in. Booming growth plus quickly rising rents in Miami, Orlando, and Tampa killed that bargain vibe.
Nevada (74 days) and Connecticut (72 days) round out the top 10. Even Connecticut’s lighter load means workers grind till mid-March just to cover rent, food, and save for a used car.
Basically, in the priciest states, 25-33% of your whole year (two to three months) goes to basics that used to take way less time.
America’s winners: states where people need to work less to pay annual rent, groceries, and save for a used car
While most of the states are freewheeling into the cost of living crisis, three states – Idaho, Arkansas, South Dakota – have defied the odds, but only to some extent.
Today, their workers need to work slightly less time to pay rent, buy groceries and slowly save for a used car than they did nearly two decades ago.
In Idaho, people now need 4.9 fewer days to cover the three basics, with annual rent alone saving 2.7 days every year.
In Arkansas, people save 3.8 days when earning to pay for the three essentials, while rent alone has given back 3.79 days annually since 2007, meaning other essentials have barely gotten cheaper.
This is equivalent to an extra long weekend off or nearly a full workweek reclaimed for family time, school runs, or a small side hustle.
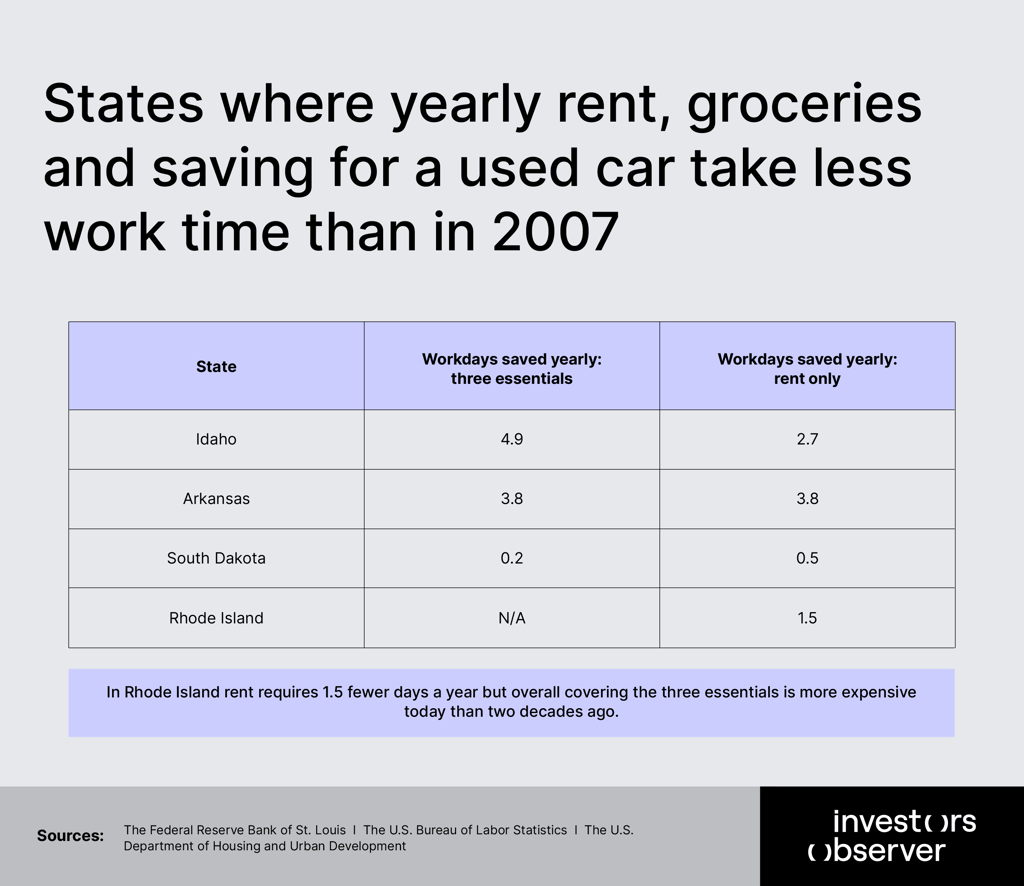
South Dakota’s gains are slim – just 0.2 days a year, when it comes to covering the three basics. Rent alone, however, saves a little more time – 0.5 days a year which means that other basics have gotten more expensive and have eaten the total of days saved.
In Rhode Island rent requires 1.5 fewer days a year but overall covering the three essentials is more expensive today than two decades ago.
These modest gains, however, are overshadowed by steeper losses elsewhere as grocery and car prices have risen since 2007. The result is a patchwork of small rent victories against the endless squeeze on everyday budgets.
Methodology and sources
We calculated workdays needed using government and industry data, comparing 2007 to 2025 on consistent terms.
Hourly earnings:
- Federal Reserve Bank of St. Louis (FRED) for 2007
- Bureau of Labor Statistics (BLS) for March 2025.
Rent:
- Department of Housing and Urban Development’s (HUD) annual Fair Market Rents for one-bedroom units across 2,000+ U.S. regions.
Used cars:
- Black Book (2025)
- Department of Energy (2007).
Groceries:
- Fixed basket of 12 staples (milk, eggs, bread, meat, produce) cost $43 in 2007 per The Pig Site
- Adjusted for 74% inflation via FRED CPI to $75 in 2025.
Workdays assume an 8-hour day. Percentage changes and net differences (wages vs. costs) complete the view.
The “extra workdays per year” figure combines:
- Recurring annual expenses (rent, groceries)
- Savings for a used car calculated based on the average age of vehicles in the U.S. in 2007 and 2025.
In 2007, the average age of vehicles in the U.S. was 9.2 years, according to R. L. Polk & Co. In 2025, the average age of vehicles in the U.S. was 12.8 years, as reported by S&P Global.